




October 20, 2026
By Dr. Fadi Zaher
Last month I wrote that every boom meets a physical limit, and that this one meets the power grid. The test came sooner than I expected. On 15 October South Korea’s main market lost around 7.6% in a single day and Japan’s fell almost 5%, led by the chipmakers that had led them up. A global equity index was close to unchanged.1 Investors had not stopped believing in artificial intelligence. They had started to question the cost of building the infrastructure behind it.
That distinction matters. This was a repricing of money, not yet of megawatts. The grid did not fail. What took a hit was the assumption that a capital-intensive boom can be financed on favourable terms. We are quick to price what artificial intelligence might earn, and far less precise about what it must consume. That gap is the thread running through these letters: in May, the lag between a shock and the day it reaches company accounts; in July, resource costs building as a charge no model catches; in September, who actually gets paid. This month, it’s what the bill looks like.
The bill behind the boom
In 2024, data centres worldwide used roughly 30% more electricity than the United Kingdom consumes in an entire year. Under the International Energy Agency’s central scenario that demand more than doubles by 2030, to slightly more than Japan’s annual consumption.2 Software scales in months. Power stations and grid connections do not. The transformer that matters most to this trade is not the one in the research paper.
Grid pressure will vary by location. A country may have enough electricity overall, while individual cities struggle to support new data centres. What starts as a technical problem can quickly become political, affecting energy bills and business costs. With US elections on 3 November³, the key question is who will pay for grid upgrades. But rather than predict election outcomes, we focus on the policies that follow and their costs for investors.
The cliff
At the Principles for Responsible Investment conference in Amsterdam on 14 October I was grateful to be part of an engaging panel on pricing emerging risks with Sonja Saunderson of the Eskom Pension and Provident Fund, Pedro Guazo of Northern Trust Asset Management and Max Tang of UBS. The session was moderated by Michal Bartek who managed to keep four people with strong views to time and asked the simplest and most useful question of the session: what is the market not pricing in today and in the future?
My answer was that mispricing is not a gradient. It is a cliff. Technology reprices in an afternoon, sometimes twice in one. Geopolitics reprices violently and is then forgotten within a quarter. Climate barely reprices, and nature, including biodiversity, is not priced in at all. If short-termism were the cause, it would blunt everything equally. It does not, which is why the gap is worth trading. And on a cliff, conviction is not the discipline. The discipline is knowing which side of the edge the price is on: before the fall, or after it.
So how do you know? We use three tests, and they run across time. The past: sort companies on a given exposure, control for the usual factors, and ask whether the spread has actually earned anything. The present: watch earnings revisions after an event and see whether exposed companies move more than unexposed ones, because a reaction after the fact tells you it was not priced before it. The future: capitalise the spending a company cannot avoid and set it against what consensus has pencilled in.
That third test is the one I took to Amsterdam, because it is the one we can now actually run. Our transition capital scenario model puts a number on the cost of transition for an individual company, for a sector and for a region, under different policy and price paths. Not a score. A cost, in money, that you can compare with a valuation. We launch it in the coming weeks, alongside the Osmosis factor strategies, which will let us offer resource-efficient and transition-style factor investing on both a single and a multi-factor basis. Most climate analysis tells you what might happen in 2050. This tells you what it costs, and whether you already own it.
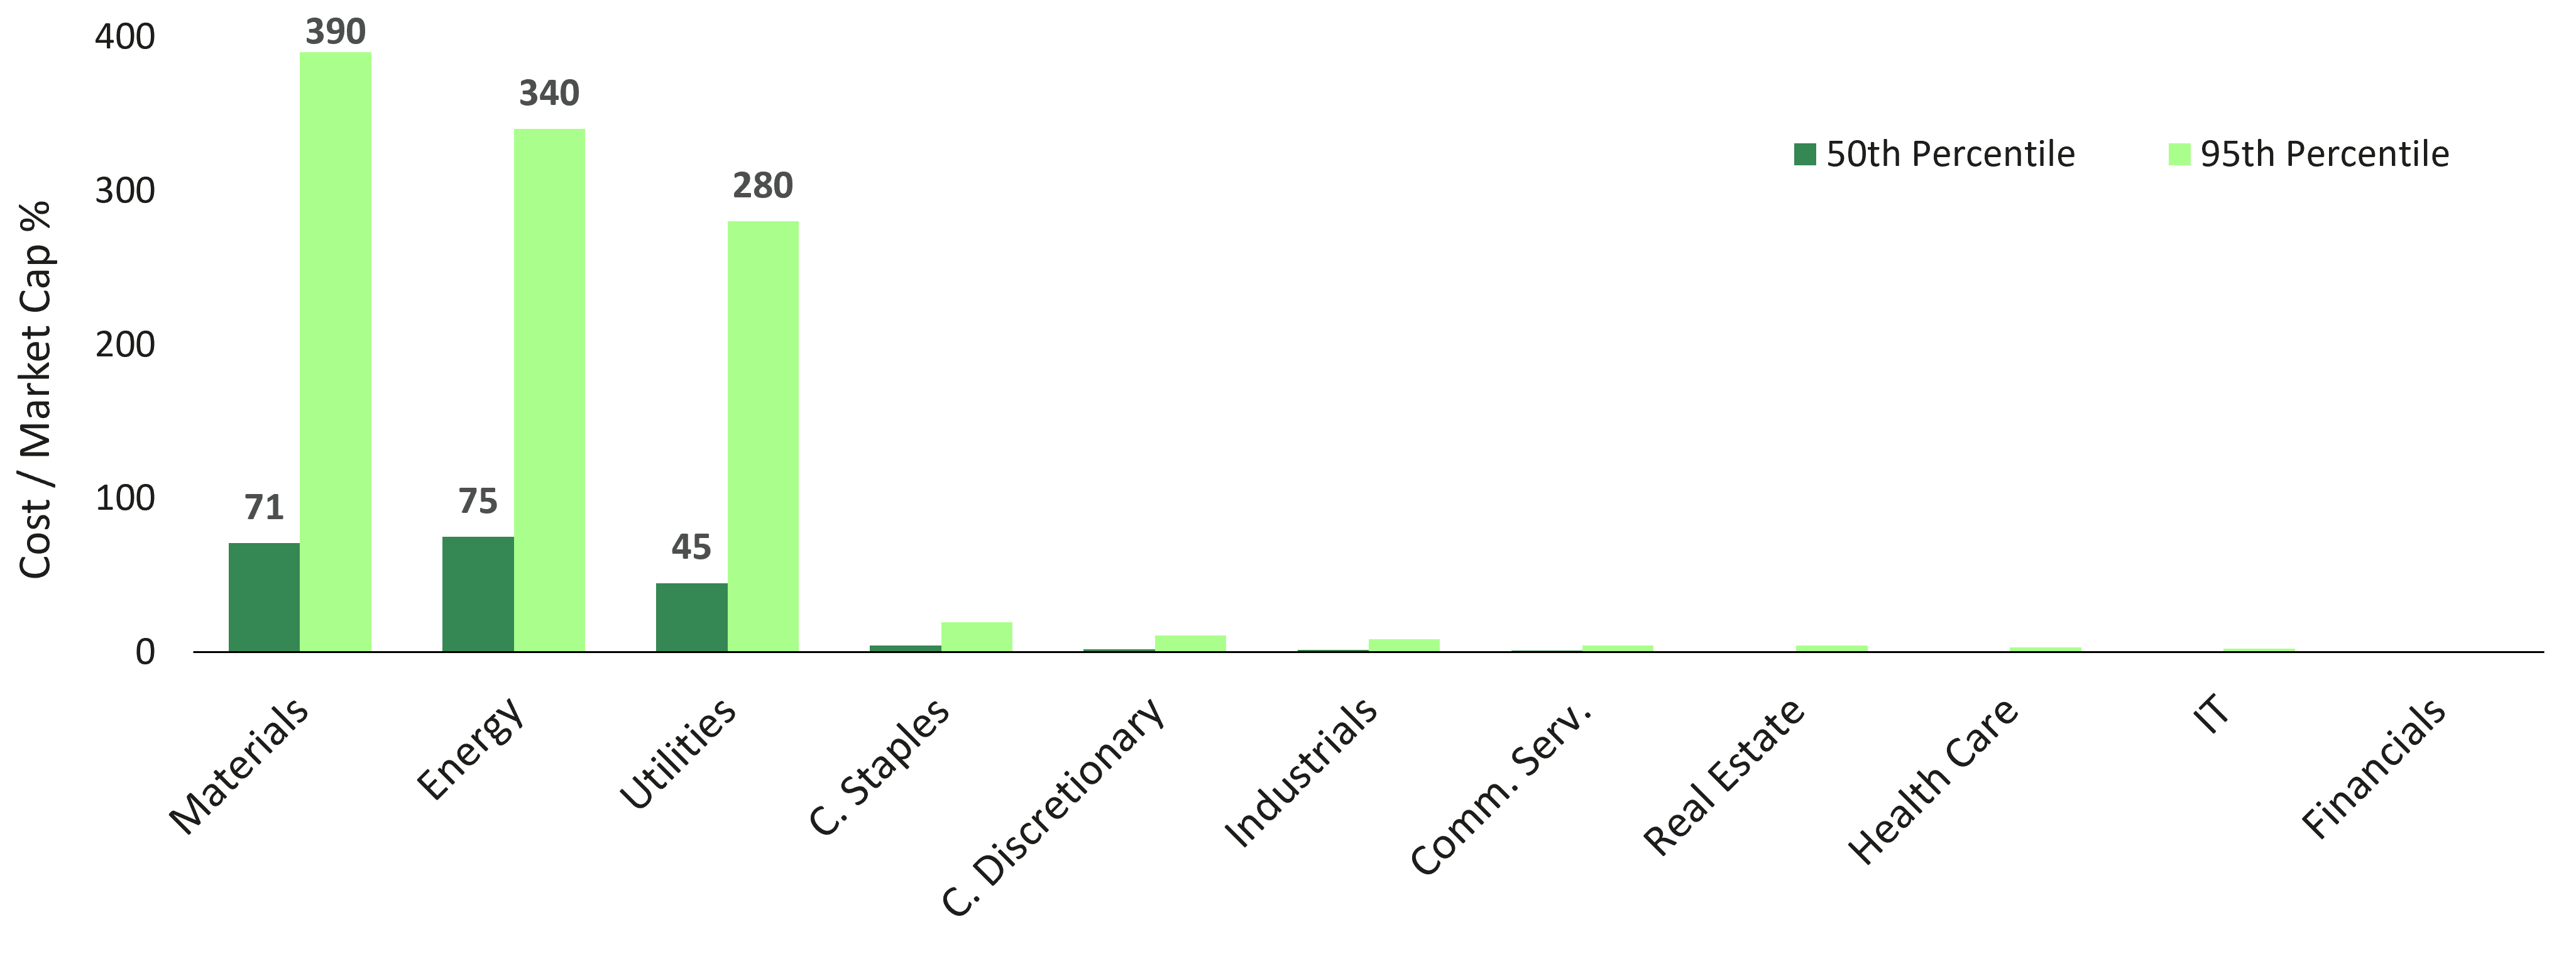
Green capex requirements are highly concentrated in a small number of carbon-intensive sectors. Materials, Energy and Utilities face median transition costs equivalent to 45-75% of today’s market value, rising to 280-390% in a extreme scenarios (representing 5% probability event). This highlights significant transition-financing risk and underscores the importance of capital allocation discipline.
Which sectors face the highest Green CAPEX costs. The median scope 1 & 2 green capex requirement by 2050 as a % of today’s market cap
Spending does not need to be a burden on finance and I would distrust any framework that assumed it was. Money that lifts productivity or prevents disruption pays for itself. The question is whether the benefit justifies the cost and whether the price already reflects both.
Two factories, one heatwave
Picture two factories exposed to the same heatwave. One loses three days of output. The other loses a quarter. This is an illustration rather than a reported case, and the difference sits within the sector, which makes it a stock selection question. It also forces a distinction worth stating plainly: resource efficiency and physical resilience are not the same thing. A company can use less water, energy and raw material per unit of output and still be badly exposed to a flood or wildfire. A safer location does not make an operation efficient. We measure both, then ask which difference reaches margins, capital needs and cash flow.
That is the standard I want our research judged by, including the model we are about to launch. A measure should make a prediction we can test and, if the evidence demands it, reject. A climate score that can never be wrong is not a measure. It is a horoscope.
October’s bill came from the lenders. The next one comes from the grid, and in a few weeks we will be able to put a number on it, company by company. A market can look away from a cost for years. The company paying it cannot.
Sources:
- 1 Reuters, 15 October 2026, “Global stocks flat as AI and rate fears hit tech”: Korea’s KOSPI and Japan’s Nikkei 225 fell sharply; MSCI’s global gauge fell 0.06%; higher funding costs raising hurdle rates on capital-intensive infrastructure. https://finance.yahoo.com/markets/stocks/articles/asian-markets-sell-off-ai-005808521.html
- 2 International Energy Agency, Energy and AI (2025): data centres used 415 TWh in 2024, about 1.5% of world electricity, rising to 945 TWh by 2030 in the Base Case. United Kingdom demand was 319 TWh in 2024 (National Energy System Operator), giving the 30% comparison; the Japan comparison is the IEA’s own. Covers all data centres, not artificial intelligence alone, and projections are uncertain. https://www.iea.org/reports/energy-and-ai/executive-summary
- 3 United States Federal Election Commission: the 2026 general election is scheduled for 3 November 2026.
- 4 Principles for Responsible Investment, PRI in Person 2026, Amsterdam, 14 October, session 4B, “Pricing emerging risks”.
- 5 Strategy performance: Osmosis Investment Management, MSCI, Northern Trust, Bloomberg, as at 29 September 2026 and 15 October 2026. Returns in US dollars, net of fees and dividend withholding tax; benchmark returns net total return. Past performance is not a guide to future returns.
Important Information
This document is issued by Osmosis Investment Management UK Limited (“Osmosis UK”). Osmosis UK is an affiliate of Osmosis Investment Management US LLC (“Osmosis US”), Osmosis Investment Management NL B.V. (“Osmosis NL”) and Osmosis Investment Management AUS Pty Ltd (“Osmosis AUS”), and has been operating the Osmosis Model of Resource Efficiency. Osmosis UK is regulated by the FCA (Reference number: 765056). Osmosis US is regulated by the SEC. Osmosis NL is licensed as a manager of AIFs and authorised to provide discretionary portfolio management services and as such is subject to supervision by the Netherlands Authority for the Financial Markets under registration number 15006165. Osmosis UK, Osmosis US, and Osmosis AUS are wholly owned subsidiaries of Osmosis (Holdings) Limited (“OHL”).
This research provided is for information purposes and does not constitute an offer or solicitation of an offer or any advice or recommendation to purchase any securities. No representations, express or implied, are made as to the accuracy or completeness of such statements, assumptions, estimates or projections or with respect to any other materials herein.
Our research identifies and scores companies from the MSCI World or Emerging Market Index that report sufficiently on at least 2 of the following 3 metrics: carbon, water, and waste, to calculate a resource efficiency score for each reporting company – the Model of Resource Efficiency. Our Core strategies overweight efficient companies and underweight inefficient companies (inefficient companies include companies without a score) within each Osmosis defined sector, to remain sector neutral to each benchmark. Our Active strategies invest only in efficient companies, outside of the Financial sector described below. Companies in the Financials sector are not given Resource Efficiency Scores. Certain strategies select Financials, based on complementary characteristics to the Resource Efficiency factor, for inclusion in the portfolio to maintain the portfolio’s overall factor weightings. All strategies exclude tobacco and companies that breach the UN Global Compact on social and governance safeguarding.
The information contained in this document has been obtained by Osmosis from sources it believes to be reliable, but which have not been independently verified. Information contained in this document may comprise an internal analysis performed by Osmosis and be based on the subjective views of, and various assumptions made by, Osmosis at the date of this document. Osmosis does not warrant the relevance or correctness of the views expressed by it or its assumptions. Except in the case of fraudulent misrepresentation or as otherwise provided by applicable law, neither Osmosis nor any of its officers, employments or agents shall be liable to any person for any direct, indirect, or consequential loss arising from the use of this document.