




Update from the CIO Dr Fadi Zaher, 19 September 2026
In 1900, railroads were over 60% of the US stock market. Today they are about 1%.1 Everyone assumes their owners were wiped out, but the railroads beat the broad US market over the century that followed.1 The industry shrank to nothing and paid its long term owners anyway.
I wrote in May about the lag between a shock and the point at which it reaches company accounts. In July, I argued that resource costs were building as a charge that most models miss, because they rarely appear as a single line item.
At the 1FinanceWorld conference*, Henning Stein asked the obvious question: if AI is as big as everyone says, why not just own it? Because the market can be right about AI and wrong about the price. Four questions hide inside that one. Will it work? Will it matter? Who survives? And, who gets paid?
The first two are almost certainly yes. The money is in the last two, and that is where investors spend the least time.
The chart below shows a clear pattern. Over the past 20 years, oil and gas, telecoms and media have all risen, peaked and then faded. Today, semiconductors lead the market, with a larger share than any of the others ever reached. Every peak looked permanent at the time and history tells us it never is.
The real question is whether, five years on from the peak and amid continued enthusiasm surrounding AI, investors are still being rewarded.
Chart 1: The rise and fall of industries
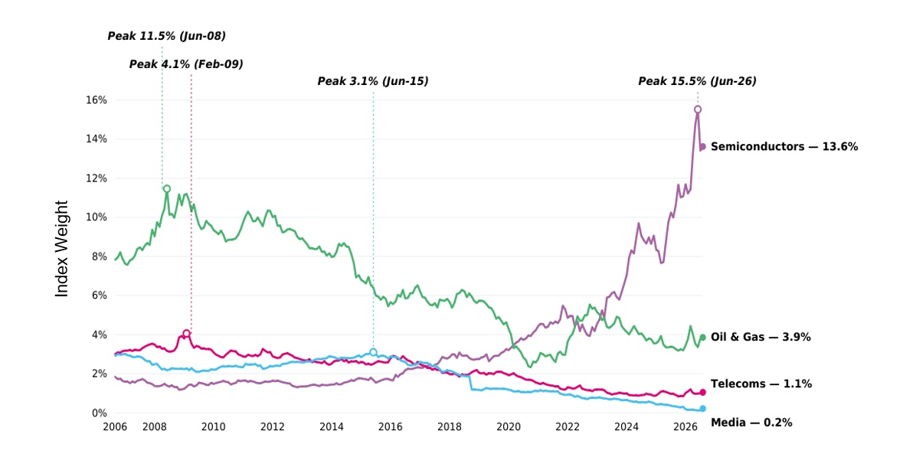
Source: Osmosis Investment Management. Data shows industry weight over time, using MSCI World universe and GICS Sector definitions. You cannot invest in an index. Past performance is not indicative of future results. Period is Jan 2006 – August 2026.
Who survives and who gets paid?
Some companies get paid whichever AI firm wins: chip tooling, power generation, transmission, transformers, cooling. They sell to all ten runners. The risk is in the crowded names. Too many look the same, can be easily swapped out, and are priced as if they already have won.
Take energy – power costs are rising across Western economies, and AI is part of the reason. The IEA predicts data-centre demand increasing from 415 TWh in 2024 to about 945 TWh by 2030, moving from 1.5% of world electricity demand to just under 3%. Compute scales faster than grids ever will. The cheerful case is AI escaping the data centre into banks, factories and hospitals. The gloomy one is the data centre discovering it cannot escape the grid. Either way, the firm making the same product with less power keeps its margin.
So how does this play out in our portfolios?
Not by buying the AI label. We look for where scarce inputs are being used better than peers, and where the market is paying for that discipline rather than a story. This quarter, that helped stock selection across our core strategies. Efficient operators in the industrials sector did much of the work, while Japanese companies helped in IT and Comms. Meanwhile, Utilities cost us: Edison and PG&E are both resource-efficient businesses, but California wildfire risk takes no interest in how efficient your grid is. Microsoft and Salesforce also hurt. Nvidia helped, which often surprises people. We own it because it currently produces more output per unit of scarce input than the alternatives. If that stops being true, that position will change.
The better question right now is whether the market is starting to reward the thing we measure. It is getting closer: dispersion is high, breadth is improving, momentum is wobbling, and fundamentals are being paid for again. But the raw factor still carries style drag. Three decent months do not change that.
What we intend to do about it
The research hands us something better than an opinion: a clock. Industries usually turn when new company formation rolls over while output is still climbing. By that measure this rush still looks early, because entrants are multiplying. But early is not the same as cheap. The question is still who converts the theme into economics. That is why we are launching the Osmosis Efficient single and multi-factor equity family. Efficiency belongs beside value, quality, momentum and low risk because it asks a different question: inside each industry, who is doing more with less? Momentum can pull you into the crowded names. Value can push you out of the theme too early. Efficiency keeps the focus on the companies doing the economic work, not just the companies carrying the label.
Avoiding AI was never the point. Not overpaying for it is. Every boom meets a physical limit in the end and this one meets the power grid. The firms that come through already make more with less.
- 1. Dimson, Elroy, Paul Marsh & Mike Staunton (2015), “Industries: their rise and fall”, Credit Suisse Global Investment Returns Yearbook 2015, Credit Suisse Research Institute, pp. 5–15.
- 2. International Energy Agency (IEA), Energy and AI, Paris, 10 April 2025, “Energy demand from AI”.
Important Information
This document is issued by Osmosis Investment Management UK Limited (“Osmosis UK”). Osmosis UK is an affiliate of Osmosis Investment Management US LLC (“Osmosis US”), Osmosis Investment Management NL B.V. (“Osmosis NL”) and Osmosis Investment Management AUS Pty Ltd (“Osmosis AUS”), and has been operating the Osmosis Model of Resource Efficiency. Osmosis UK is regulated by the FCA (Reference number: 765056). Osmosis US is regulated by the SEC. Osmosis NL is licensed as a manager of AIFs and authorised to provide discretionary portfolio management services and as such is subject to supervision by the Netherlands Authority for the Financial Markets under registration number 15006165. Osmosis UK, Osmosis US, and Osmosis AUS are wholly owned subsidiaries of Osmosis (Holdings) Limited (“OHL”).
This research provided is for information purposes and does not constitute an offer or solicitation of an offer or any advice or recommendation to purchase any securities. No representations, express or implied, are made as to the accuracy or completeness of such statements, assumptions, estimates or projections or with respect to any other materials herein.
*This video is issued by a third party. Any opinions referenced are as of the date of publication and are subject to change due to market or economic conditions, and may not necessarily come to pass. Forward-looking statements cannot be guaranteed.
The investment examples set forth in this presentation should not be considered a recommendation to buy or sell any specific securities. There can be no assurance that such investments will remain in the strategy. The case studies have been selected to be included in this presentation because we believe these are indicative of our strategy and investment process. Nothing herein shall be deemed to limit the investment strategies or investment opportunities to be pursued by Osmosis.
Our research identifies and scores companies from the MSCI World or Emerging Market Index that report sufficiently on at least 2 of the following 3 metrics: carbon, water, and waste, to calculate a resource efficiency score for each reporting company – the Model of Resource Efficiency. Our Core strategies overweight efficient companies and underweight inefficient companies (inefficient companies include companies without a score) within each Osmosis defined sector, to remain sector neutral to each benchmark. Our Active strategies invest only in efficient companies, outside of the Financial sector described below. Companies in the Financials sector are not given Resource Efficiency Scores. Certain strategies select Financials, based on complementary characteristics to the Resource Efficiency factor, for inclusion in the portfolio to maintain the portfolio’s overall factor weightings. All strategies exclude tobacco and companies that breach the UN Global Compact on social and governance safeguarding.
The information contained in this document has been obtained by Osmosis from sources it believes to be reliable, but which have not been independently verified. Information contained in this document may comprise an internal analysis performed by Osmosis and be based on the subjective views of, and various assumptions made by, Osmosis at the date of this document. Osmosis does not warrant the relevance or correctness of the views expressed by it or its assumptions. Except in the case of fraudulent misrepresentation or as otherwise provided by applicable law, neither Osmosis nor any of its officers, employments or agents shall be liable to any person for any direct, indirect, or consequential loss arising from the use of this document.