


By Alienor Hammer, Environmental Research Analyst
Executive Summary
This analysis compares good and bad sustainability reporting practices, using real-world examples to highlight how clear, measurable data is superior to broad or aspirational disclosures. Key differences lie in the use of consistent metrics and transparent reporting frameworks.
Key Takeaways
- Transparency Beats Quantity: High disclosure rates are not enough — clarity, scope, and reliability matter more than raw quantity.
- Good Reporting = Clear, Consistent, Comparable Data: Effective reports explain the numbers, cover the full company scope, and offer useful context.
- Bad Reporting = Gaps, Inconsistencies, and Ambiguity: Missing metrics, selective disclosures, and unclear methodologies undermine credibility.
- Osmosis Leads the Way: We engage with companies directly to improve data quality and shape the future of environmental reporting.
Why Clear and Transparent Reporting Matters
There is currently no global standard for environmental reporting. As a result, companies can disclose similar metrics in vastly different ways, making comparisons difficult and sometimes misleading.
At Osmosis, we believe transparency is the foundation of sustainable investing. Without clear, reliable and comparable data, investors cannot accurately assess how companies manage their environmental footprint. That’s why we go beyond surface-level data collection. We validate, verify, and challenge disclosures, ensuring the data we use to construct our portfolios is both accurate and meaningful.
The Global Reporting Landscape
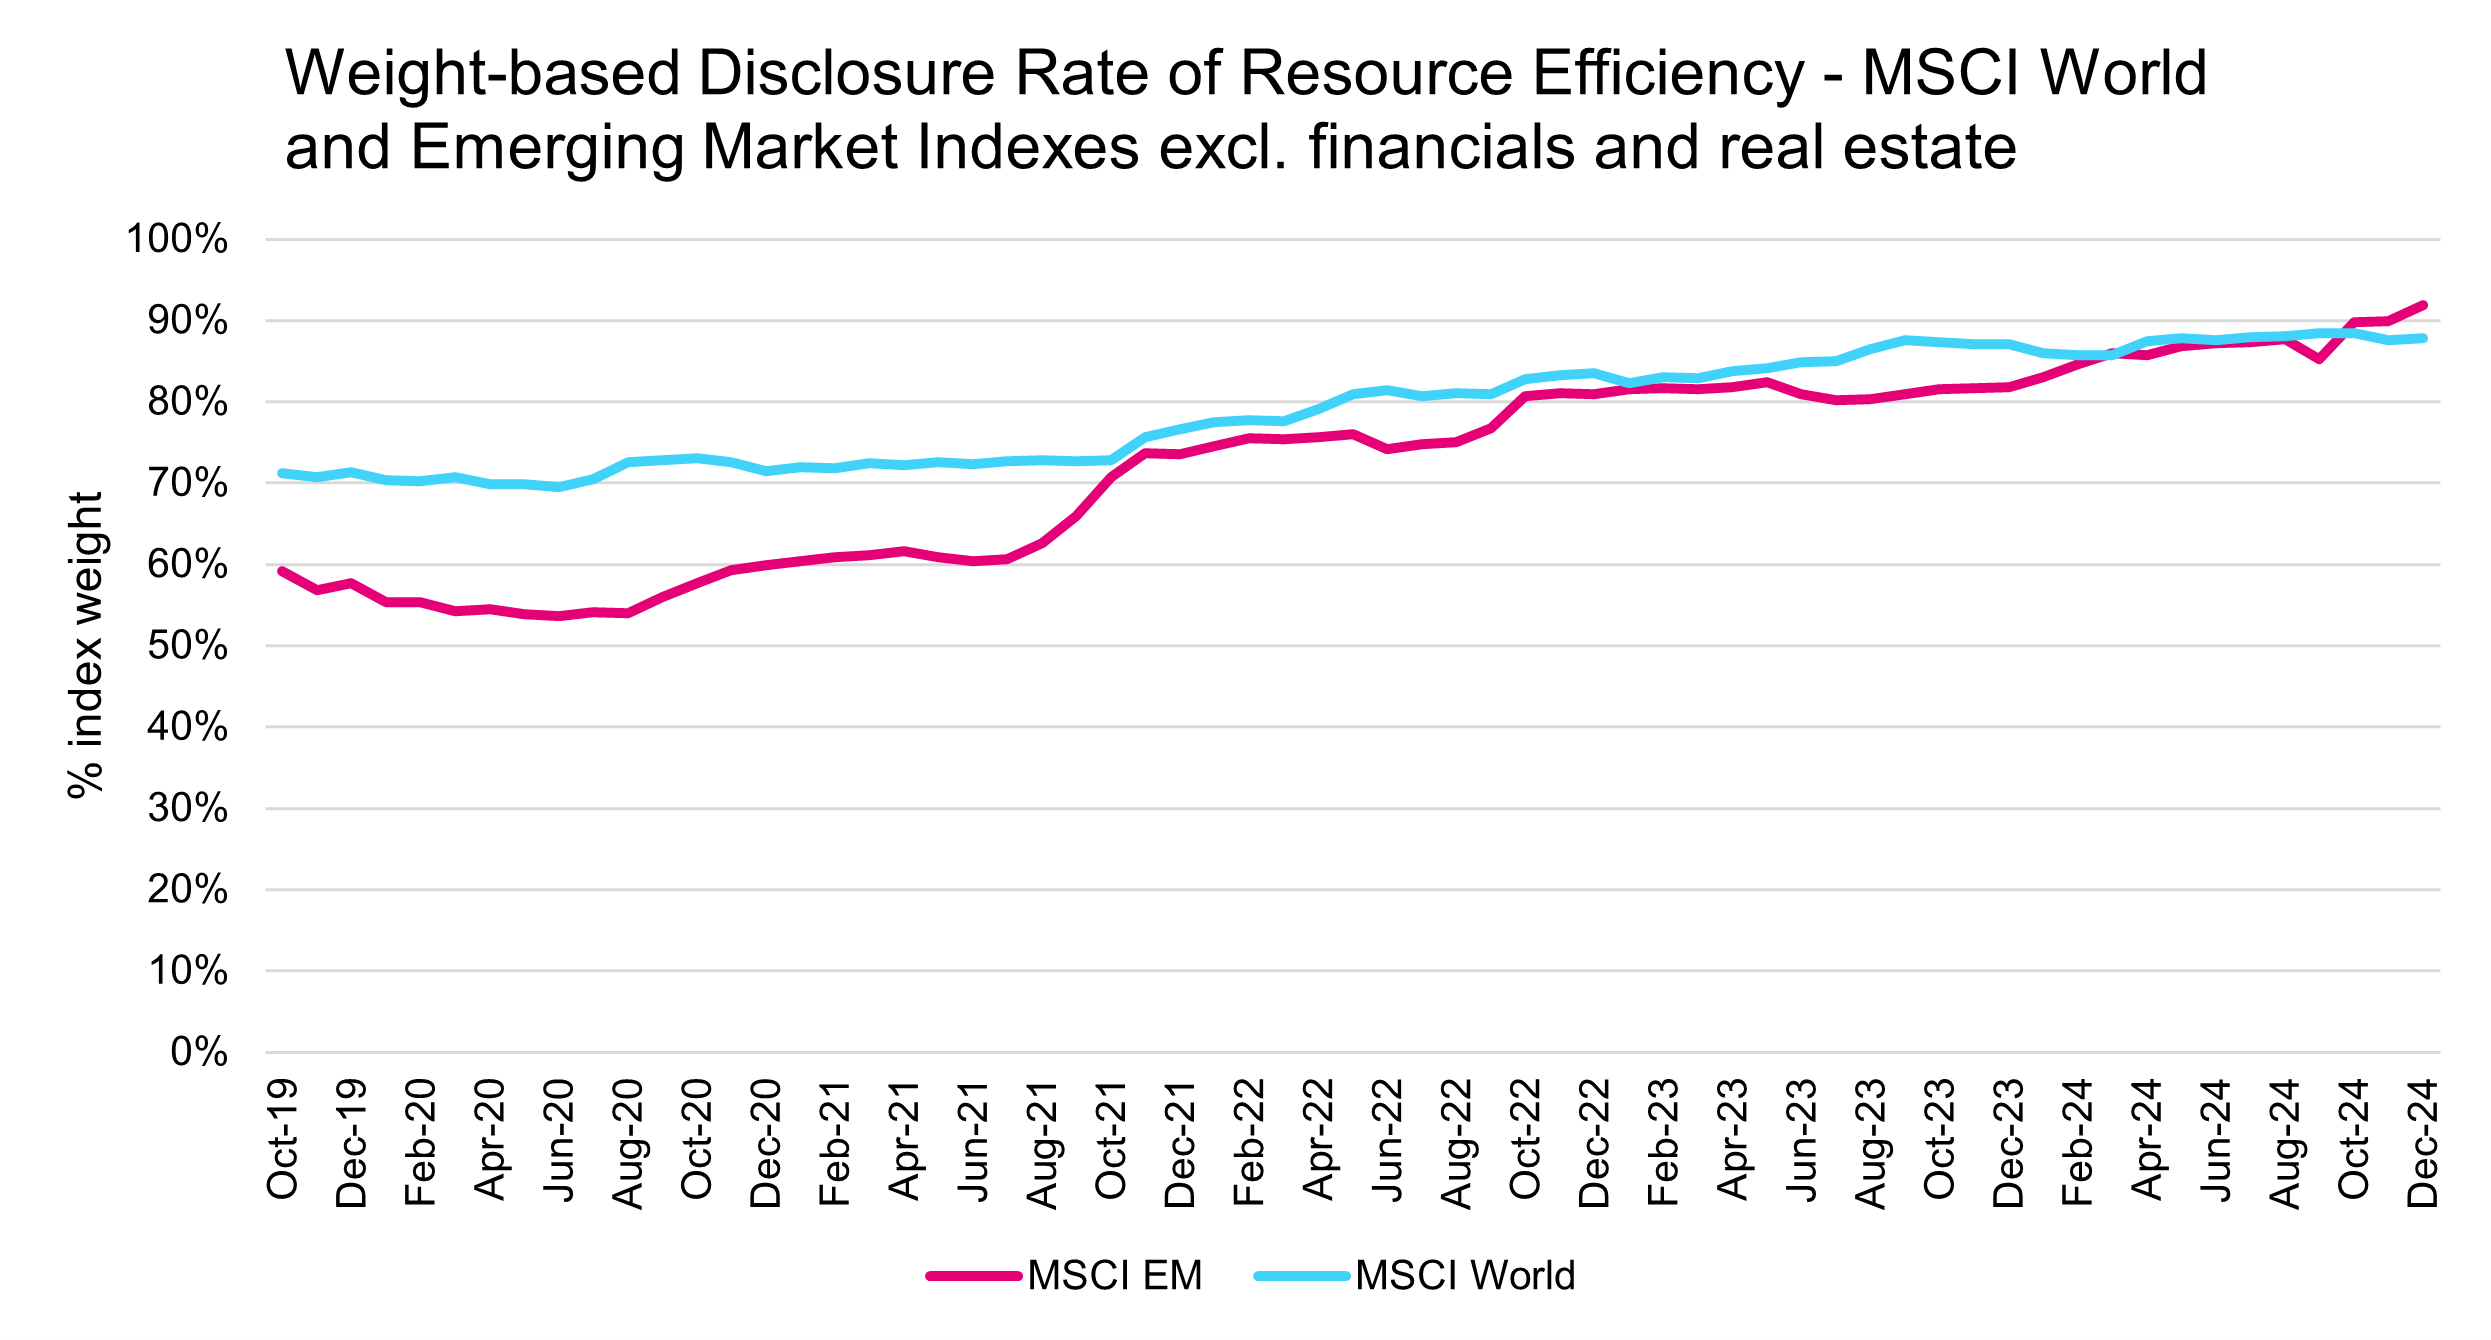
Rising Disclosures: Sustainability reporting is no longer limited to a few environmentally progressive countries or companies. According to our research, participation is growing rapidly, with 70% of companies in MSCI Emerging Markets Index (Emerging Markets) now disclosing environmental data, rapidly narrowing the gap with MSCI World Index (Developed Markets) where disclosure stands at 76%.
Disclosure Drivers: Both voluntary initiatives and new disclosure mandates are accelerating this shift. Mandatory frameworks, such as the EU’s Corporate Sustainability Reporting Directive (CSRD), which took effect in 2024, require companies to disclose a wide range of sustainability metrics. Similar rules are being introduced in India, the Philippines, and the UAE, covering climate risk, science-based targets, social issues, human rights, and anti-corruption.
No Universal Standard: While global frameworks such as Taskforce for Climate-related Disclosures (TCFD), Sustainability Accounting Standards Board (SASB), and Global Reporting Initiative (GRI) are developing increasingly detailed and industry-specific standards, inconsistencies remain high across regions, sectors, and companies.
Bottom line: Disclosure is improving, but quality and comparability are not guaranteed.
What Does Good Reporting Look Like?
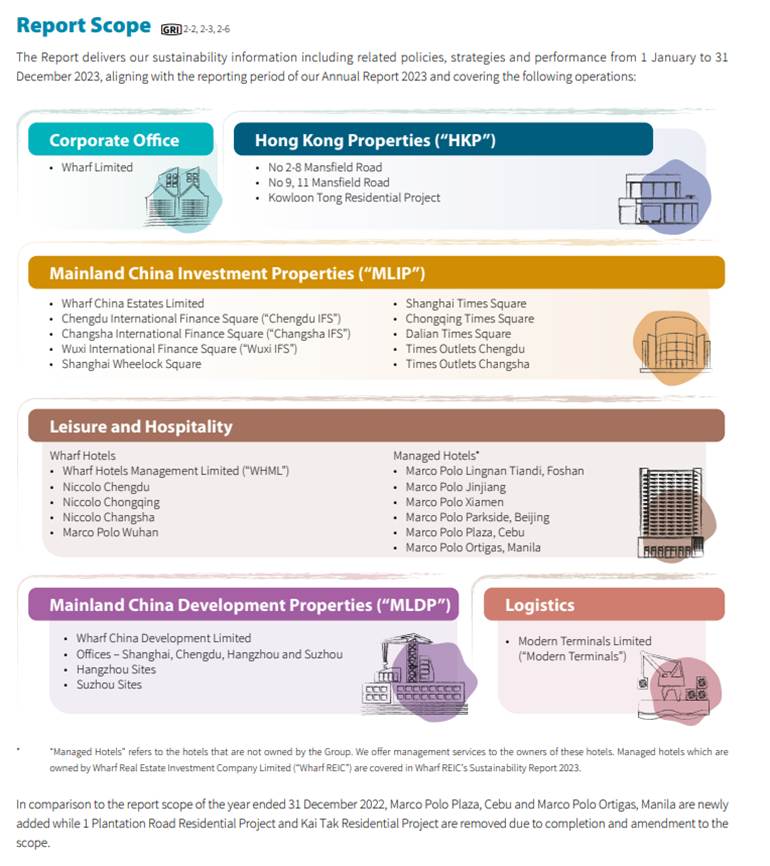
Clear Scope Across the Business
Good reporting captures data across the full operational footprint, not just select sites or standout subsidiaries. Wharf Holdings, a Hong Kong-based real estate company, offers a strong example. Its Sustainability Report 2023 outlines environmental disclosures across business segments, subsidiaries, and managed properties. This prevents misleading intensity figures, which can occur when companies report environmental data from only part of the business, but divide by the business’ total revenue.
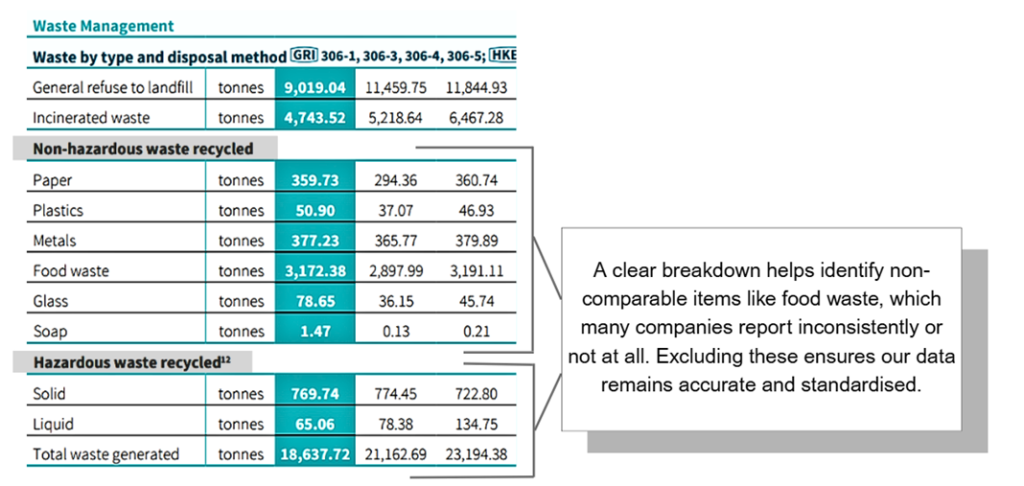
Granular Data
As seen in Figure 3 Wharf Holdings breaks down key categories, for instance separating hazards from non-hazardous waste. This level of detail enables investors to identify areas of material environmental impact to them and helps companies target efficiency improvements that can enhance overall performance. At Osmosis, we exclude non-comparable factors like food waste, which many firms report inconsistently or not at all. A detailed breakdown allows us to exclude the data we deem irrelevant or incomparable, ensuring what we record is consistent and standardised across our database.
Easy-to-Read Visuals
Mondi, a general industrials company, enhances its reporting through diagrams that map water sources, usage, and discharge across operations. These visualisations do more than aid communication, they improve data interpretation. By illustrating where water enters and exits the system, they help contextualise the company’s total environmental impact and ensure the figures used in analysis are materially relevant.
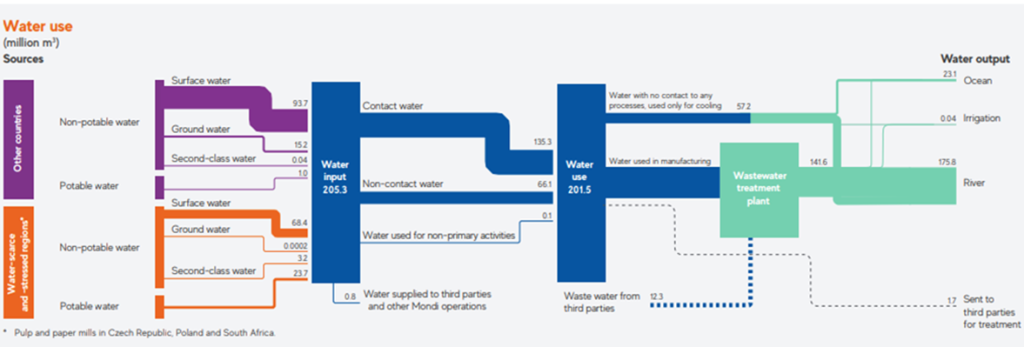
Figure 4. Mondi’s water use streams as disclosed in its Sustainability by Design Report 2023.
Transparent Methodology
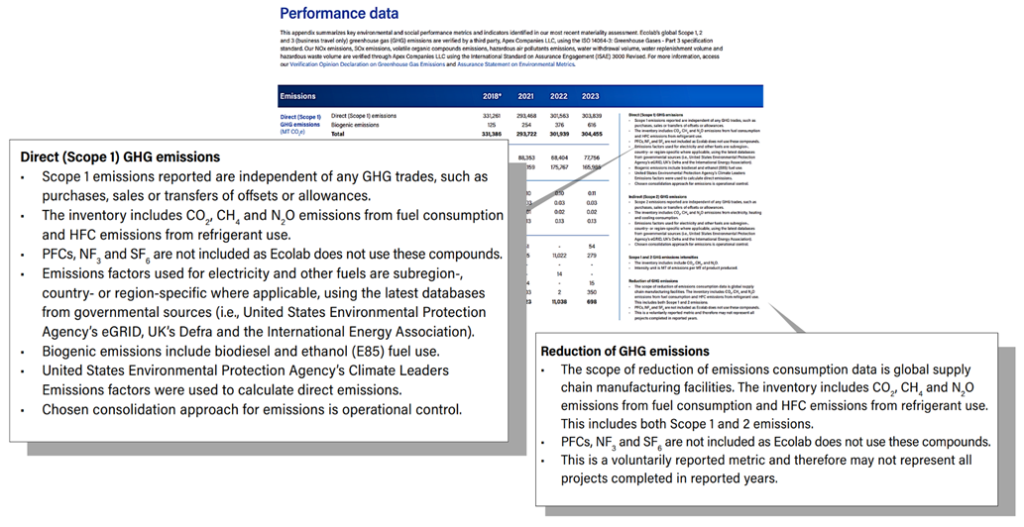
Ecolab, a US-based water, hygiene and infection prevention services company, provides a clear explanation of how it calculates Scope 1 and Scope 2 emissions. The company explicitly states what is included in its boundaries and what is excluded, for example perfluorocarbons (PFCs), nitrogen trifluoride (NF₃), and sulfur hexafluoride (SF₆) are omitted because they are not used in its operations. This specificity enhances comparability and data integrity.
Why it matters
Good reporting makes numbers trustworthy, comparable, and actionable, in turn enabling better investment decisions.
What Makes Reporting Bad?
Incomplete Scope Hides True Impact
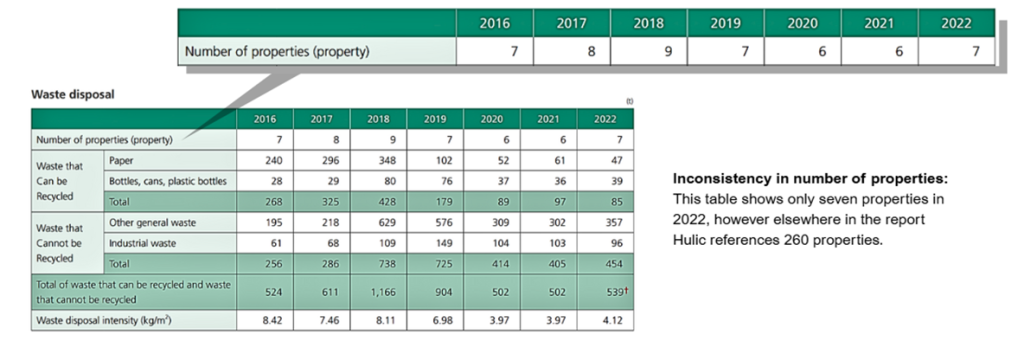
Some companies report on only a small subset of their operations, leading to a distorted view of performance. For example, Hulic, a Japan-based real estate company, discloses waste data for just seven of its 260 rental properties. This narrow scope misrepresents the company’s full environmental footprint and undermines the credibility of its sustainability disclosures.
Inconsistent Data Raises Red Flags
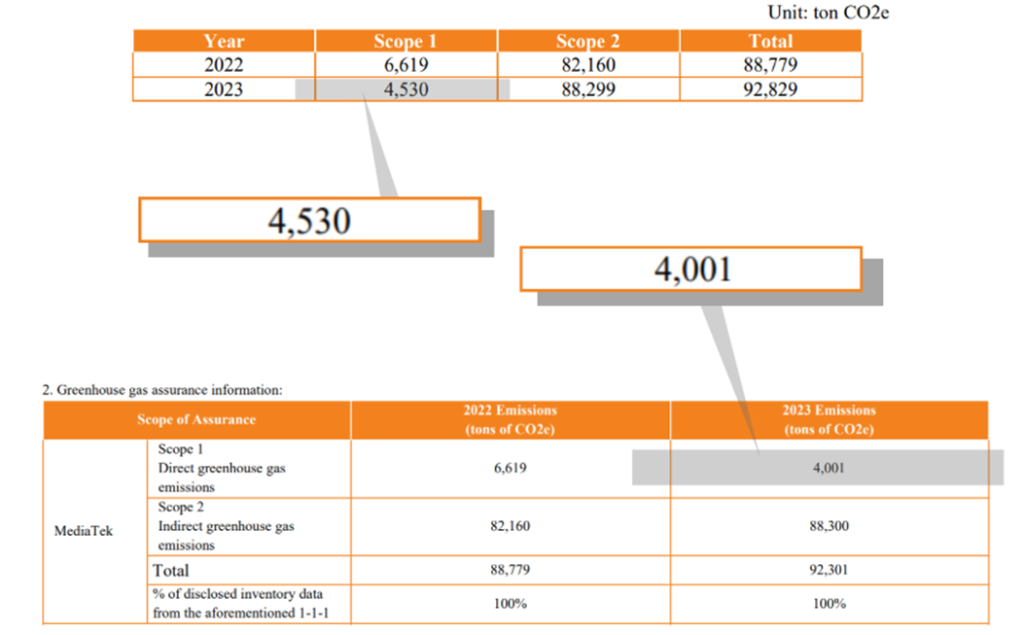
Mediatek, a Taiwan-based semiconductor company, produced an Annual Report in 2023 that lists two conflicting Scope 1 emissions figures: 4,001 and 4,530 tons. These figures appear in separate sections of the same document without any accompanying explanation. This inconsistency raises concerns about the reliability of the data and makes it difficult to determine which figure is accurate. After engaging with the company to rectify the issue, it confirmed its emissions as 4,001 ton CO₂e and corrected the disclosure.
Discrepancies like this are rarely detected by automated data-scraping tools. At Osmosis, our manual validation process ensures such issues are identified early, reducing the risk of recording flawed data in our models.
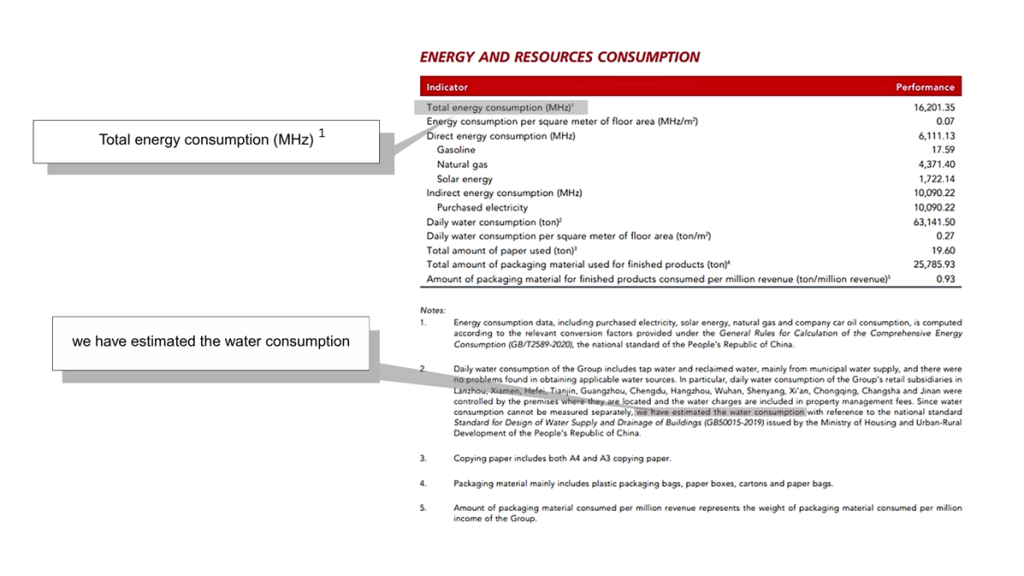
Incorrect Units and Estimated Values Undermine Reliability
Li Ning, a China-based sportswear and sports equipment company, reports total energy use using the wrong unit — MHz (a measure of frequency), instead of MWh (a measure of energy). In the same report, water consumption data is marked as estimated, rather than measured. These issues significantly reduce the reliability of the company’s environmental reporting. At Osmosis, such data is flagged and excluded. We also ensure to notify the company if we notice the mistake, as was done with Mediatek. In this instance, Li Ning was contacted to highlight the mistake. We avoid estimations and third-party proxies to ensure data integrity. This level of attention to detail is critical to maintaining the accuracy of our research.
Non-Comparable Aggregation Obscures Meaning
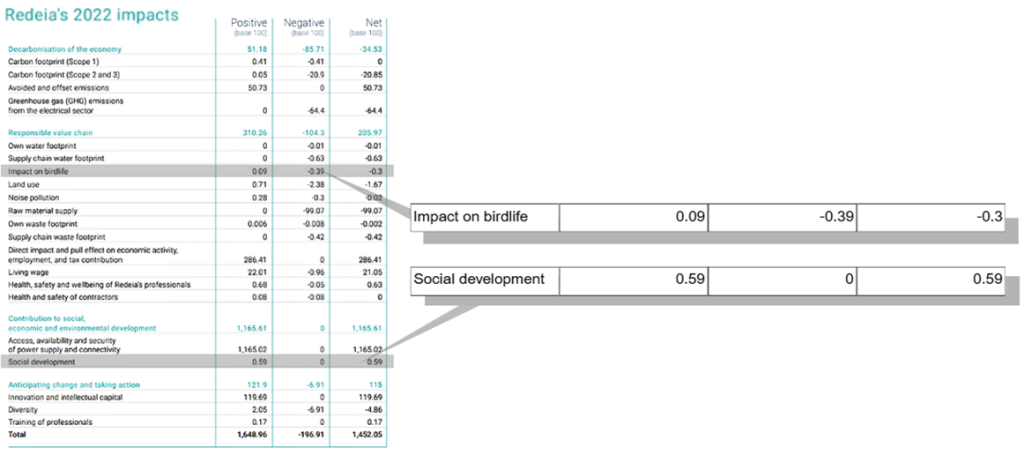
Redeia, a Spain-based electric utility company, aggregates unrelated environmental impacts into a single, undisclosed score in its 2023 report, without detailing the underlying methodology or reporting scope. This approach removes transparency and prevents meaningful analysis. Investors cannot assess what the metric represents, how it’s calculated, or compare it across companies and time periods. For example, impacts such as a birdlife score and a social development score are derived from different data sources, with different assumptions, yet are reported as a single figure, giving the illusion of precision without clarity.
Why It Matters
Using incorrect units, reporting incomplete data, or aggregating figures without explanation undermines the credibility of sustainability disclosures. These issues can lead to data being excluded or misinterpreted, making it harder to assess a company’s true performance. Without clear and accurate reporting, investors cannot properly evaluate risk, compare companies, or make informed decisions.
Osmosis: Setting the Standard
At Osmosis, our research is built on a foundation of high-quality, validated data. We go beyond surface-level figures by assessing methodology, scope, and resource use to ensure each datapoint is accurate, consistent, and informative. Unlike off-the-shelf providers that rely on automated scraping, every datapoint we use is manually reviewed by our analyst team.
Our validation process includes:
- Careful, line-by-line review of corporate reports
- Assessment of calculation methods, units, and assumptions
- Exclusion of incomplete, estimated, or unclear disclosures
This process is strengthened by deep sector and regional expertise. Analysts meet weekly to review flagged datapoints and share insights. This collaborative approach:
- Allows for contextual interpretation of complex or ambiguous data
- Draws on specialised knowledge across different regions and industries
- Helps ensure consistency and accuracy across the full dataset
In 2024 alone, we contacted 218 companies to clarify or improve reported data. This meticulous approach ensures that only reliable, decision-ready data enters our models and in turn our portfolios.
Conclusion: Toward True Transparency
Environmental reporting is improving, but full standardisation is still lacking. New standards from organisations like GRI and SASB are helping to drive more detailed, industry-specific reporting. However, while such initiatives are likely to improve global comparability, we are still a long way from the strict standards applied to financial data, In both Emerging and Developed Markets, Osmosis continues to see a wide range in data quality, from transparent, well-scoped disclosures to reports with limited or flawed data.
In the absence of universal standards, engagement remains the most effective way to address inconsistencies and raise reporting quality. By working directly with companies, we help correct errors, clarify scope, and drive better disclosure. As a result, investors have access to more reliable, decision-ready data they can trust. For Osmosis, the accuracy and verification of these essential data points continues to improve the efficacy of our models and our proprietary resource efficient investment signal which sits at the heart of our portfolio construction.
Important Information
Global Investors
This report is issued in the UK by Osmosis Investment Management UK Limited (“Osmosis UK”). Osmosis UK is authorised and regulated by the Financial Conduct Authority “FCA” with FRN 765056. This document is a “financial promotion” within the scope of the rules of the FCA. In the United Kingdom, the issue or distribution of this document is being made only to and directed only at professional clients (as defined in the rules of the FCA) (“Professional Clients”). This document must not be acted or relied upon by persons who are not Professional Clients. Any investment or investment activity to which this document relates is available only to Professional Clients and will be engaged in only with Professional Clients. Osmosis UK has been operating the Osmosis Model of Resource Efficiency.
US Investors
This document is issued by Osmosis Investment Management US LLC (“Osmosis US”). Osmosis US is a registered investor advisor with the SEC. Registration with the SEC does not imply any level of skill or training.
Australian Investors
This document is issued by Osmosis Investment Management AUS Pty Ltd (“Osmosis AUS”). Osmosis AUS is a corporate authorised representative of Eminence Global Asset Management Pty Ltd (AFSL 305573).
Osmosis UK, Osmosis US and Osmosis AUS are wholly owned subsidiaries of Osmosis (Holdings) Limited (“OHL”), collectively referred to as “Osmosis”.
This research provided is for information purposes and does not constitute an offer or solicitation of an offer or any advice or recommendation to purchase any securities. No representations, express or implied, are made as to the accuracy or completeness of such statements, assumptions, estimates or projections or with respect to any other materials herein.
The information contained in this document has been obtained by Osmosis from sources it believes to be reliable, but which have not been independently verified. Information contained in this document may comprise an internal analysis performed by Osmosis and be based on the subjective views of, and various assumptions made by, Osmosis at the date of this document. Osmosis does not warrant the relevance or correctness of the views expressed by it or its assumptions. Except in the case of fraudulent misrepresentation or as otherwise provided by applicable law, neither Osmosis nor any of its officers, employments or agents shall be liable to any person for any direct, indirect, or consequential loss arising from the use of this document. The investment examples set forth in this document should not be considered a recommendation to buy or sell any specific securities. There can be no assurance that such investments will remain in an Osmosis strategy or have ever been held in an Osmosis strategy.
None of the company examples referred to above are intended as a recommendation to buy or sell securities. The information is intended only for the use of eligible and qualified clients and is not intended for retail clients. The information does not constitute an offer or solicitation for the purchase or sale of any security, commodity or other investment product or investment agreement, or any other contract, agreement, or structure whatsoever. Recipients are responsible for making your own independent appraisal of and investigations into the products referred and not rely on any information as constituting investment advice. Investments like these are not suitable for most investors as they are speculative and involve a high degree risk, including risk of loss of capital. There is no assurance that any implied or stated objectives will be met. Osmosis has based the information obtained from sources it believes to be reliable, but which have not been independently verified. Osmosis is under no obligation and gives no undertaking to keep the information up to date. No representation or warranty, express or implied, is or will be made, and no responsibility or liability is or will be accepted by Osmosis, or by any of its officers, employees, or agents, in relation to the accuracy or completeness of the information. No current or prospective client should assume that future performance will be profitable the performance of a specific client’s account may vary substantially due to variances in fees, differing client investment objectives and/or risk tolerance and market fluctuations.
Information in this presentation is intended to be viewed in its entirety. The reproduction, downloading, streaming or other disclosure of such information, in whole or in part, without prior consent of Osmosis is prohibited. Neither this presentation, nor any copy of the information available on it, may be taken into or transmitted in any jurisdiction where it would be unlawful to do so.