


By Bob Stoutjesdijk, Global Macro Strategist
Quick Read:
- Both Fed and ECB are now cornered on both sides of their mandate, with no policy rate that addresses inflation and growth simultaneously.
- Global liquidity has split into three distinct regimes: Fed easing under operational cover, ECB still tightening, China expanding aggressively.
- The K-shape between large and small caps has widened materially after the Iran shock, exposing structural vulnerabilities in the bottom half of the market.
- Credit risk is migrating from public high-yield to leveraged loans and private credit, where stress is being masked by distressed exchanges.
- The IG credit curve has flattened to its 15th percentile in 24 years, but unlike previous flat moments, it is no longer signalling distress at all.
- We hold a defensive bias: short-to-intermediate duration, up in quality, with a structural preference for covered bonds and senior secured paper.
- Markets are pricing the most benign outcome; we position for the asymmetry, because the cost of being wrong about complacency is far higher than being early about caution.
Macro: Cornered on both sides
In our February note we wrote that the United States and Europe were on visibly different trajectories. Three months later, that picture has hardened. Both central banks now find themselves cornered on both sides of their mandate. The famous line that has shaped our internal debate recently is that the error is no longer in the cutting rates; it is in being trapped.
The Fed has held the funds rate at 3.50-3.75% across three consecutive meetings. The April vote split four ways: two members voted for a 25 bps cut, four to hold, two for a 25 bps hike, and one abstained, pending Stephen Warsh’s confirmation as Chair on 15 May. This is the first three-way FOMC split since October 1992. The Committee has come to resemble the Bank of England’s MPC, where routine three-way splits are the norm. Warsh inherits a committee with no consensus on direction.
The data behind the Committee’s discomfort is itself uncomfortable. Non-farm payrolls came in at +178k for March, but February was revised down sharply to -133k. Unemployment is now 4.3%, up from 4.0% at the start of the year. The Iran war has produced a stagflation shock, with Brent up more than 40% from late February to early May, gasoline approaching $4.50 per gallon, and core CPI re-accelerating.
The ECB picture has reversed completely. After cutting in late 2025, the ECB has held at 2.0% across three consecutive meetings, and President Lagarde has been notably careful to leave the option of hikes open. Markets are now pricing rate hikes for the second half of 2026, quite differently from three months ago. The new ECB staff projections show inflation at 2.6% (versus 1.9% previously) and growth at just 0.9%, exactly the stagflation backdrop that breaks the simple “cut to support growth” reflex.
The deeper constraint affecting both central banks is sovereign debt service cost. The US runs a deficit of roughly 7% of GDP into a debt stock of around 123% of GDP, heading towards 140% by the end of the decade on current trajectories, and Eurozone interest costs have roughly doubled since 2022. Investment Grade (IG) corporate balance sheets, by contrast, are clean; large-cap companies refinanced extensively at very low fixed rates in 2020-21. The most levered borrower in this cycle is the sovereign, not the private sector. The bond market’s tolerance for further policy tightening is now becoming the binding constraint.
This is the trap. Cut to support the cyclical bottom of the economy, and you risk losing the inflation anchor and pushing government bond term premium higher in an environment where the sovereign is already the most levered actor. Hold or hike to anchor inflation, and the cyclical bottom of the economy deteriorates faster. There is no policy rate that addresses both at the same time. The error is no longer in the cutting; it is in being trapped.
Liquidity: A Tale of Three Regimes
Policy rates are one lever; liquidity is another. When a central bank buys bonds it adds money to the financial system, when it lets bonds run off it withdraws money. That backdrop has split into three distinct regimes, wide enough that “global liquidity” is no longer a single variable.
In the United States, the Fed formally ended Quantitative Tightening (QT) in December 2025 and began buying bonds again on 12 December. Between December and April it expanded its balance sheet by roughly $230bn, around $40bn per month. The April FOMC additionally shifted $200bn from mortgage bonds to agency debt. We called this in February easing under operational cover. The Fed is adding liquidity at a pace consistent with a cutting cycle, even as it holds the funds rate steady. That partly explains why risky assets are stronger than one might think.
Europe is the mirror image. The ECB’s balance sheet is still shrinking, with forecasts pointing to a fall from EUR 6.0tn to EUR 5.7tn by end-2026, an 11% reduction. The cash that European banks hold at the ECB has already roughly halved since 2022, from EUR 4.9tn to EUR 2.6tn. The ECB is therefore tight on rates and tight on liquidity, into a slowing economy. This is the most restrictive policy mix in the major developed economies, happening just as the rate curve has reversed to pricing hikes.
China is the wildcard, and its scale is underappreciated. The total money circulating in the Chinese economy is now roughly $48 trillion, more than twice the US money stock of $23 trillion. Since 2018, US money supply has grown around 66%, and China’s by 74%, despite a weaker yuan. The Chinese central bank has been easing aggressively, but most of that money is absorbed by local governments, property developers and state companies servicing existing debts rather than funding new growth. The spillover into global asset prices is real, particularly into gold and hard assets where Chinese central bank and household buying has been a structural support.
The K-Share Deepens: From Equity into Credit
In our February note, we described the divergence between large and small caps, between high-quality and distressed credits, as a defining feature of this cycle (K-shape). Three months on, the K has not narrowed, it has widened (divergence has increased actually), and the energy shock from the Iran war has accelerated the trend.
Start with equities. The Russell 2000 entered correction territory in March, falling more than 10% from its January highs, while the S&P 500 was off only around 7%. That gap is structural: roughly 32% of Russell 2000 debt is tied to floating rates, compared with just 6% for the S&P 500, with refinancing rates 150 to 200 bps above the 2021 levels at which much of this debt was issued. The broader trend is well-documented by the Bank for International Settlements (BIS): the share of listed zombie firms across advanced economies has risen from around 2% in the late 1980s to over 17% during the 2020 pandemic shock. Market estimates since suggest the share among US listed firms sits at around 15%, and within the Russell 2000 specifically as high as 25%[1]. Meanwhile the cash-rich mega caps act like synthetic banks, with higher rates increasing their net interest income on hundreds of billions in cash reserves. The same monetary policy is restrictive for one half of the index and accommodative for the other.
The same K shows up in credit, and in a very specific shape
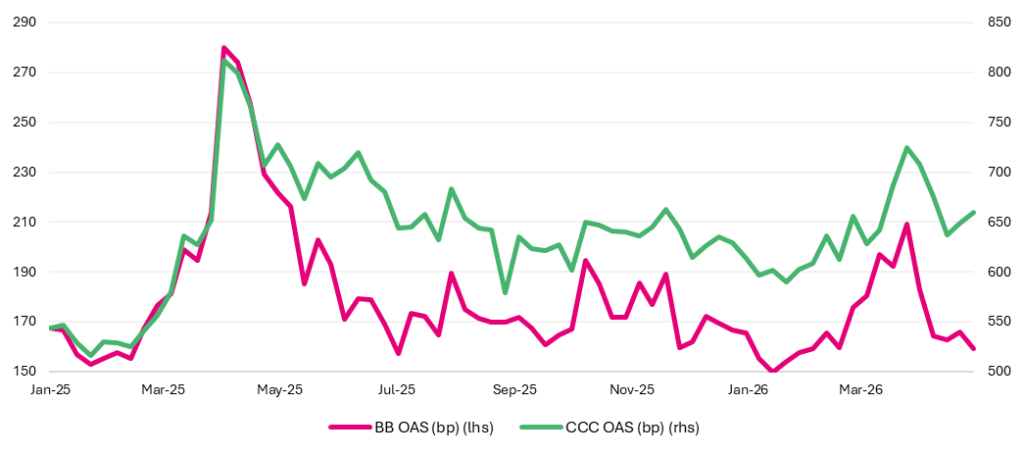
US Option-Adjusted Spreads (OAS), as of 6 May 2026: Investment Grade (IG) at roughly 79 bps, BB at 159 bps, CCC at 660 bps. Against the long-run pre-COVID average (2000 to 2019: IG 155 bps, BB 363 bps, CCC 857 bps), IG and BB are materially tighter than history while CCC sits closer to its norm (see Graph 1 for BB and CCC divergence since January 2025). The top half of the credit market is pricing as if there is no cycle; the bottom half is pricing as if there clearly is one.
The Iran shock made this visible in real time. CCC widened by roughly 130 bps from late February to its 27 March peak (724 bps); IG widened by just 10 bps. By 6 May, IG and BB were back at pre-shock levels, actually slightly tighter, while CCC remained 100 bps wide of its 2025 lows. CCC is doing what credit is supposed to do: differentiating between issuers that can refinance and those that cannot.
Graph 1: K-Shape BB-CCC spreads
Firstly, IG has almost no risk premium left. At 79 bps, IG is more than 75 bps tighter than its long-run average. With minimal carry, full duration exposure, and a sovereign-debt overhang, we have little tolerance for adding generic IG beta. We continue to prefer covered bonds and senior secured/preferred paper, where you give up some yield but get materially better structural protection in typical decompression scenarios.
Secondly, BB at 159 bps is trading like a slightly cheaper version of IG. Dispersion within the rating bucket has widened materially since late 2024, and disciplined bottom-up work continues to surface specific issuers with deleveraging stories or structural protections, where the spread genuinely compensates for the risk. BB is no longer the systematic sweet spot of the High Yield (HY) market; it is a stock-picker’s market within a compressed average.
Thirdly, the CCC-BB differential has widened to roughly 500 bps, well above its 2025 trough of around 360 bps and consistent with the early stages of a credit deterioration cycle. Historically, BB tightness rarely “saves” CCC once this differential starts widening. It reinforces the case to stay up in quality.
Fourthly, the public credit data understates the real stress, because the most levered borrowers in this cycle are no longer in the public BB/CCC indices. They are in private credit and leveraged loans, where pricing adjusts slowly via Net Asset Value (NAV) marks rather than continuously via market spreads. The Russell 2000 zombie cohort and the private credit borrowers in the next section are largely the same companies under different financing wrappers.
The implication is that monetary policy itself is now caught in the K. Aggregate financial conditions and large-cap equities suggest policy is too loose; CCC spreads, small-cap performance and lower-income consumer data suggest policy is too tight. There is no single policy rate that addresses both, which is precisely why the FOMC vote split four ways in April. The Fed is no longer just observing the K-shape, it is trapped by it.
Defaults Cooling on the Surface, Bifurcating Underneath
Headline default rates have improved over the last 18 months. Moody’s Ratings reports the trailing 12-month US speculative-grade default rate is drifting back toward its long-run average, well below the 8.6% pandemic peak[2]. For leveraged loans, the picture is different: default rates ran at roughly 7% to 8% through 2025, nearly double the 4.6% historical average since 1996[3]. The headline message is “easing”, but only after starting from genuinely high levels and only for the part of the credit market with fixed-rate funding.
The structural reason is straightforward. High-yield bond issuers refinanced extensively at fixed rates in 2020 to 2021, and were largely insulated from the 2022 to 2024 hiking cycle. Leveraged loan issuers, by contrast, hold floating-rate debt and took the full force of the higher-for-longer rate environment.
The K in default rates is more pronounced than headline numbers suggest…
Firstly, Moody’s Analytics reports that as of March 2026 the average one-year expected Probability of Default (PD) for all US listed companies stood at 7.9%, down from 9.1% a year earlier, but still elevated by historical standards (the pre-COVID norm sits at 4 to 5%). For the smaller, unrated, lower-quality firms that dominate the bottom of the listed universe, implied risk remains materially higher and stickier.
Secondly, the gap between public and private credit has become observable through public Business Development Companies (BDCs). As of March 2026, average PD-implied risk for publicly traded BDCs exceeded that of Baa-rated public corporates by the widest margin since post-pandemic normalisation, while the share of Payment-In-Kind (PIK) income has continued to rise[4]. The data is opaque, but the BDC tape signals private direct lending default rates sit well above the high-yield bond rate, and rising.
Distressed exchanges deserve a separate mention. A growing share of what nominally “is not” a default – debt-for-debt swaps, maturity extensions, PIK toggles activated, payment deferrals – does the same economic damage to the lender without showing up in the headline default series. DBRS Morningstar’s data indicate that distressed exchanges have come to represent the dominant share of private-credit “credit events” over the past 12 to 18 months. A clear “amend and pretend cycle” in our view.
The IG Credit Curve: Cornered into Long Duration
We have argued that the IG market is paying its investors very little for taking on cyclical risk. There is a second, more subtle point: IG investors are also being paid almost nothing for taking on duration. The credit curve, long IG OAS minus intermediate IG OAS, has flattened to a level historically only seen at moments of acute stress. Today it sits there because of the opposite condition: complacency, driven by buyers that are themselves cornered into the trade.
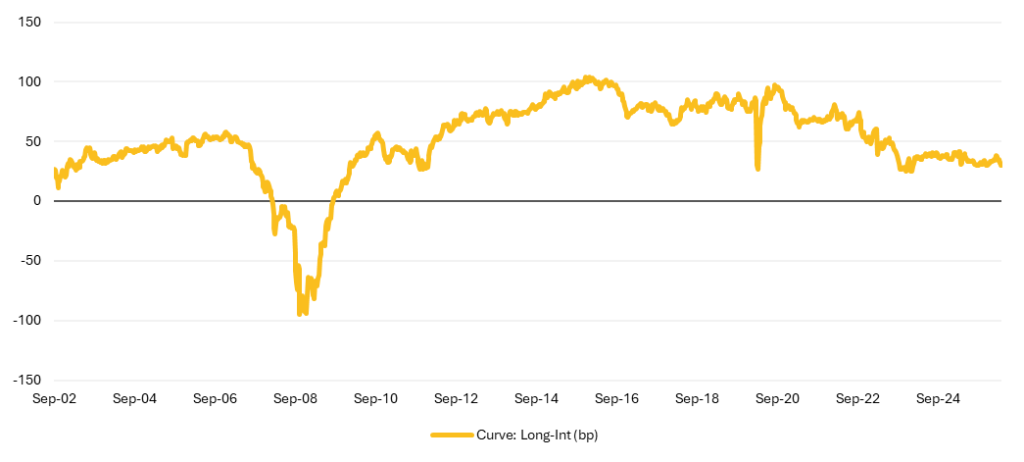
As of early May, US IG Intermediate OAS was around 64 bps at a duration of 4.2 years; US IG Long OAS was around 95 bps at 12.1 years (see Graph 2). The curve was therefore approximately 30 bps. The long-run pre-COVID average (2002 to 2019) was 50 bps; the 2017 to 2019 benign period sat closer to 80 bps. We are currently in the 15th percentile of the entire 2002 to 2025 period.
In our 24-year dataset, the credit curve has actually inverted only once: a 79-week episode running from late February 2008 to August 2009. The curve dropped below 10 bps in late December 2007, and crossed into negative territory on 29 February 2008. The full crisis followed over the next eight months, but the curve had been signaling distress six months before Lehman fell.
Other near-inversion moments tell a consistent story. In March 2020 (COVID shock), the curve flattened by 41 bps in one week before the Fed reversed it within 10 days. In March 2023 (Silicon Valley Bank crisis), a 22 bps single-week flattening resolved as the Federal Deposit Insurance Corporation backstops contained the contagion. In April 2025 (Liberation Day tariff scare), a 10 bps flattening was brief and reversed within a fortnight. The credit curve flattens fast and dramatically when systemic stress hits, then reverses. The way it has flattened in 2024 to 2026 is unlike any of these: gradual, persistent, untouched by repeated macro shocks. The flat curve today is not the market signalling distress; it is the market failing to signal anything at all. That is a different problem.
Graph 2: US Credit Curve
The driver is a structural buyer base for which long IG paper is non-discretionary. Long-duration corporate bonds have become the dominant Asset-Liability Management (ALM) matching asset for US insurance and pension liabilities, particularly as Pension Risk Transfer (PRT) flows and annuity issuance have surged. These buyers are price-insensitive; they need long, high-quality assets regardless of spread. They are, in the spirit of this edition, cornered into the trade just as policy is cornered on both sides.
The mirror image is the Treasury market. The 10-year Treasury yield is around 4.4%, the 30-year sits closer to 5.0%, with fiscal sustainability concerns pushing Treasury term premium up. Government term premium is expanding while corporate IG term premium is compressing. That gap cannot persist indefinitely.
The duration trade and the credit trade are now indistinguishable, and both are unfavorable on a risk-adjusted basis at the long end of the curve. At 30 bps of curve, the implied compensation per year of additional duration is below 4 bps, well within the noise of weekly OAS movements. The asymmetry is one-way against being long duration in IG. Covered bonds and senior secured become structurally more attractive: shorter-dated, with recovery features that the buy-and-hold IG market has bid away.
Conclusion
The defining feature of this cycle is no longer when the Fed will cut, or by how much. It is that the Fed, and increasingly the ECB, has fewer good options at every meeting. Cut to support the bottom of the K, and you risk losing the inflation anchor; hold to anchor inflation, and the bottom of the K deteriorates faster. Long IG buyers are cornered into the trade by their own liability profile, and the credit curve has stopped signalling distress as a result. There is no path that does not entail a cost; the only choice is which cost to pay.
Markets, for now, are pricing the most benign version of this story. Spreads are tight, curves are flat, equity is supported. Our job is not to argue with that pricing in the short term, but to position for the asymmetry it creates. We hold a defensive bias: short-to-intermediate duration, up in quality, with a structural preference for covered bonds and senior secured paper. We continue to prefer cash-rich large-cap quality over high-beta small-cap exposure.
We are not predicting a near-term shock. We are saying the system has reached the point where one is no longer required to produce a meaningful repricing. When prices reflect a benign outcome and the underlying constraints are tightening, the cost of being wrong about complacency is much higher than the cost of being early about caution. Tight spreads are more risky than wide spreads hence we apply a margin of safety principle in our investment process. The market is calm because it is cornered, not because it is safe.
[1] Bloomberg, “The Ranks of Corporate Zombies Are Growing: Credit Weekly”, November 2025
[2] Moody’s Ratings, “Will corporates hold steady across the globe in 2026?”, December 2025
[3] Moody’s Analytics, “US Corporate Default Risk in 2026”, April 2026
[4] PIMCO, “Private Credit’s Other Lanes Still Offer Value”, March 2026
Download PDF:
Important Information
Osmosis Investment Management NL B.V. (Osmosis NL) is licensed as an Alternative Investment Fund Manager (AIFM) under the Alternative Investment Fund Managers Directive (AIFMD) and the Dutch Financial Supervision Act (Wet op het financieel toezicht, Wft) and authorized to provide discretionary portfolio management services. Osmosis NL is subject to supervision by the Dutch Authority for the Financial Markets (AFM).
This document and any marketing communication are intended solely for Professional Investors as defined in the Wft. It is not directed at, nor intended for distribution to, any person in any jurisdiction where such distribution would be unlawful.
The information provided is for general information purposes only and does not constitute investment advice, a recommendation, research or an offer or solicitation to buy or sell any financial instrument. It is not tailored to individual circumstances or investment objectives.
The views expressed are as of the date of publication of this document and may change without notice. Although this information is obtained from sources believed to be reliable, no representation or warranty is made as to its accuracy or completeness. Osmosis NL accepts no liability for any direct or indirect loss arising from use of this information.
Past performance is not a reliable indicator of future results. No representation or warranty is made that any account or investment will achieve results similar to those shown. Actual results may differ substantially due to factors such as market conditions, timing and pricing of trades, portfolio composition, fees, and client circumstances. Investments can fall as well as rise in value and may result in the loss of capital. Forecasts, projections, or targets are for illustrative purposes only and are not guaranteed in any way.
Any investment examples included herein are for illustrative purposes only and do not constitute a recommendation to buy or sell any specific security. There is no assurance that such investments will remain in the strategy or have ever been held. Case studies have been selected on a non-performance basis as indicative of the investment approach and process.
Benchmark information is provided for comparison purposes only. Indices are unmanaged, not available for direct investment, and do not reflect the deduction of fees or expenses, which would reduce returns. Past benchmark performance is not a reliable indicator of future results, and the referenced benchmarks may not be appropriate for all investors.
If reference is made to an investment fund, please refer to the relevant fund’s prospectus or offering documents with more details on investment objectives, costs, and risks before making any final investment decisions.
Scenarios and performance presented are estimates based on past data and current market conditions and are not exact indicators of future results. Actual outcomes will vary depending on market performance and the duration of investment.
Clients are encouraged to consult their own legal, tax, accounting, and other professional advisers before making investment decisions and to promptly inform Osmosis NL of any changes to their investment objectives or financial situation.
For Australian Investors: Osmosis NL is a Corporate Authorised Representative (CAR 001316961) of Eminence Global Asset Management Pty Ltd (EGAM) (AFSL holder 305573). Where Osmosis NL provides financial services in Australia, it does so as an authorised representative on behalf of EGAM. The information and materials contained in this document have been prepared for accredited wholesale clients only, as defined by the Corporations Act 2001 (Cth) and in accepting the content of this document, you warrant that you are such an investor.