


By Bob Stoutjesdijk, Global Macro Strategist
Marketing material – for professional investors only
Quick Read:
- The bottom of the US high yield market looks like it is getting worse. Look closer and it is splitting in two.
- The average CCC spread widened over the past year. The typical CCC bond went the other way. A handful of companies explain the whole difference.
- Healthy CCC companies keep leaving the index: upgraded, bought out or repaid above face value. Weaker ones get downgraded in. The index looks better while the bucket gets more extreme.
- Two fifths of CCC now trades close to par and yields little more than a single-B bond. A seventh trades near sixty cents and yields over thirty per cent. The rating cannot tell them apart.
- Refinancing is the real test. The bonds in the index pay less than their borrowers would have to pay to refinance today, and the gap is widest for the weakest.
- In the Yield Era the income is the return. Protecting it takes research on individual companies, not exposure to a rating bucket. Stock picking, in other words.
In our Credit Quarterly Outlook, we introduced the Yield Era. High government debt, persistent deficits, an ageing workforce, geopolitical tension and a triple capex boom in defence, artificial intelligence and the energy transition, all bidding for the same scarce resources. That keeps inflation sticky and yields high and volatile. The consequence is the thesis we keep coming back to: returns will come mostly from the income you collect, not from falling rates or tightening spreads.
Through the Debt Supercycle, when a two-decade fall in yields lifted everything, simply being in the market was most of the answer for most investors. Now, the income is the return, and the main threat to it is a borrower who cannot refinance. Hence, as part of our Yield Era thesis, we expect more credit events to occur. Understanding where we are in the credit cycle, and which companies survive, is our core job. A focus on quality and margin of safety (valuation) will be key!
Picture the market as a K: strong balance sheets, pricing power and cheap funding on the rising arm; higher rates, weak demand and too much debt on the falling one. The average flattens out even as the gap grows, and that divergence is where both the opportunities and the accidents live. This month we took the K one layer down, into the bottom of the US high yield market, and did the work bond by bond. The K is there too, running inside a single rating bucket.
One Bucket, Two Populations
Over the past year the average spread on the CCC part of the index widened. Read that alone and you would conclude the lower-rated part of high yield is underperforming. The median CCC bond went the other way: its spread narrowed and its price rose. Same bucket, same twelve months, opposite signs.
The difference is the tail. A handful of companies account for more than the entire move, one of them for close to half of the change. More than half of the borrowers present in both years trade tighter than they did. This is not a bucket underperforming. It is a bucket where dispersion is increasing – see Figure 1. The share of CCC trading at tight spreads grew, and the share trading at distressed levels grew by about as much. The middle, where a normal distribution keeps most of its weight, fell by the same amount.
Two fifths of the CCC bucket now trades close to par and yields barely more than a single-B rated bond: rated CCC, priced like B. A seventh trades near sixty cents on the dollar and yields over thirty per cent. This distinction is lost in the rating itself, underscoring that security selection matters more than the letter grade.
Figure 1: The middle of the CCC bucket is emptying
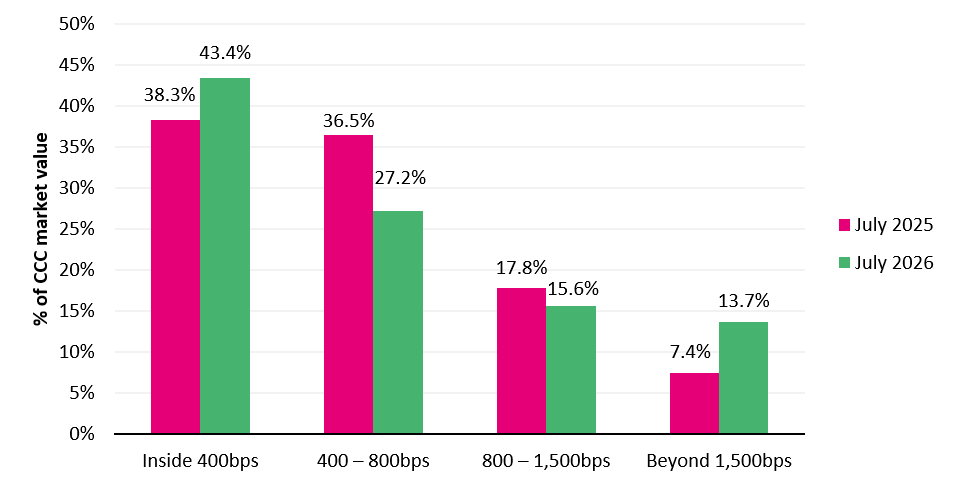
Why so split? Migration. Of all the CCC companies in the US HY index a year ago, more than a third were upgraded and almost a fifth left the index altogether, mostly bought out, called or refinanced at or above face value, not defaulted. The bucket is then refilled from above with single-B borrowers downgraded in, arriving at far wider spreads. The average index rating is the best it has been in more than thirty years, but we would argue much of that is turnover, not repair.
Refinancing is the Test
Higher-for-longer shows up in one number: what new debt costs against what old debt cost. The bonds in the US HY index carry an average coupon of 6.7%, while new paper has been coming to the market at around 7%. The bonds falling due first are the oldest and cheapest of all: those maturing in 2027 pay barely 5%. As they roll, the interest bill steps up, as highlighted in Figure 2.
Two thirds of the index must be refinanced within five years, and almost all of the step-up sits in the first three years. The step-up is steeper the lower the credit rating, too: over the past year new BB paper arrived about 60bps above the paper it replaced, new B paper more than 110bps above, and new CCC paper more than 200bps above.
It is worth separating two things that often get combined. Leverage is how much debt a company carries; coverage is whether its earnings comfortably pay the interest on it. Across public high yield the first is not the problem: debt is high, but it is slowly coming down. The second is where the Yield Era bites, because coverage falls the moment cheap debt is replaced with expensive debt, whatever the company does. That is why the two halves of the US high yield market are drifting apart on both measures: leverage and interest coverage have been improving for the better half of high yield (BB- and B- rated issuers) while deteriorating for the worst of it (CCC-rated issuers).[1]
Figure 2: The interest bill steps up as the cheapest paper matures
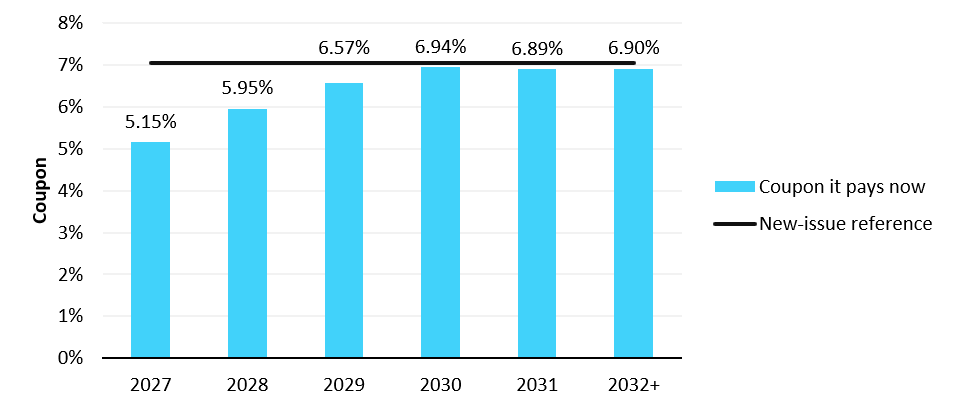
There is another, quieter reason the public high yield market looks better in terms of credit quality: the percentage of the weakest borrowers is slowly falling over time. They sit increasingly in private credit and the loan market, where payment-in-kind features let a struggling company defer cash interest rather than default, and where stress surfaces late. Public high yield is flattered by the companies that have left it.
Stock Picking
The conclusion is not to avoid the bottom of the market, but to acknowledge that the letter grade has lost its informational value, making independent analysis indispensable. This is what the Yield Era does to our work. The income is the predominant part of the return, so protecting it means knowing which borrower can refinance, at what price, and whether the credit fundamentals are improving or not. The average will not tell you, and neither will the index. Only research on the individual company will, done name by name and before the market reprices rather than after.
So, we buy names, not buckets: companies that are cheap, offer a genuine margin of safety, and whose fundamentals are stable or improving. Finding those and avoiding the ones dressed up to look like them is what we do. It is something we have been doing in our Global High Yield Strategy since the start. Stock picking it is!
Download PDF:
Important Information
Osmosis Investment Management NL B.V. (Osmosis NL) is licensed as an Alternative Investment Fund Manager (AIFM) under the Alternative Investment Fund Managers Directive (AIFMD) and the Dutch Financial Supervision Act (Wet op het financieel toezicht, Wft) and authorized to provide discretionary portfolio management services. Osmosis NL is subject to supervision by the Dutch Authority for the Financial Markets (AFM).
This document and any marketing communication are intended solely for Professional Investors as defined in the Wft. It is not directed at, nor intended for distribution to, any person in any jurisdiction where such distribution would be unlawful.
The information provided is for general information purposes only and does not constitute investment advice, a recommendation, research or an offer or solicitation to buy or sell any financial instrument. It is not tailored to individual circumstances or investment objectives.
The views expressed are as of the date of publication of this document and may change without notice. Although this information is obtained from sources believed to be reliable, no representation or warranty is made as to its accuracy or completeness. Osmosis NL accepts no liability for any direct or indirect loss arising from use of this information.
Past performance is not a reliable indicator of future results. No representation or warranty is made that any account or investment will achieve results similar to those shown. Actual results may differ substantially due to factors such as market conditions, timing and pricing of trades, portfolio composition, fees, and client circumstances. Investments can fall as well as rise in value and may result in the loss of capital. Forecasts, projections, or targets are for illustrative purposes only and are not guaranteed in any way.
Any investment examples included herein are for illustrative purposes only and do not constitute a recommendation to buy or sell any specific security. There is no assurance that such investments will remain in the strategy or have ever been held. Case studies have been selected on a non-performance basis as indicative of the investment approach and process.
Benchmark information is provided for comparison purposes only. Indices are unmanaged, not available for direct investment, and do not reflect the deduction of fees or expenses, which would reduce returns. Past benchmark performance is not a reliable indicator of future results, and the referenced benchmarks may not be appropriate for all investors.
If reference is made to an investment fund, please refer to the relevant fund’s prospectus or offering documents with more details on investment objectives, costs, and risks before making any final investment decisions.
Scenarios and performance presented are estimates based on past data and current market conditions and are not exact indicators of future results. Actual outcomes will vary depending on market performance and the duration of investment.
Clients are encouraged to consult their own legal, tax, accounting, and other professional advisers before making investment decisions and to promptly inform Osmosis NL of any changes to their investment objectives or financial situation.
For Australian Investors: Osmosis NL is a Corporate Authorised Representative (CAR 001316961) of Eminence Global Asset Management Pty Ltd (EGAM) (AFSL holder 305573). Where Osmosis NL provides financial services in Australia, it does so as an authorised representative on behalf of EGAM. The information and materials contained in this document have been prepared for accredited wholesale clients only, as defined by the Corporations Act 2001 (Cth) and in accepting the content of this document, you warrant that you are such an investor.
Website: www.osmosisim.nl
[1] Apollo Global Management, “2026 Credit Outlook: From Scarcity to Selection – The Return of a Buyer’s Market”, January 2026, Exhibits 30 and 31 (data as of September 2025).