
By Victor Verberk, CEO/CIO and Bob Stoutjesdijk, Strategist
The Osmosis Fixed Income Team has experienced many credit-market cycles, both upturns and downturns. Since the early 2000s, the starting point of our process has been – and will remain – a thorough review of the credit-market cycle.
Tokenmaxximization
Quick Read:
- The Yield Era is here: returns now come from the income you collect, not from falling rates or tightening spreads.
- A triple capex boom in defence, AI and energy keeps inflation sticky and pushes central banks to tighten, not cut.
- AI is the boom to watch: ~85% of sector revenue is internal capex recycling; it needs real outside paying customers to last.
- Companies are healthy, deleveraging from strong balance sheets; the real leverage now sits with governments and private credit.
- Valuations are tight almost everywhere: only US CCC stands out, so the cushion in spreads is thin.
- We stay neutral and patient: collect the carry, own the strong side of the K in terms of stock picks.
Fundamentals – Economics
The era of cheap money, disinflation and falling yields is behind us. This ‘Debt Supercycle’ we have been writing about for two decades. Now, we call what replaced it the ‘Yield Era’: high government debt, persistent deficits, an ageing workforce, geo-political tensions and a vast investment bill all lift inflation and interest rates and make yields more volatile. The takeaway has not changed since our first edition: returns now come primarily from the income you collect, not from falling interest rates or spread tightening. Credit analysis matters again – for companies and governments alike. The Yield Era will also see more credit events.
What keeps yields high is a triple capex boom: defence, artificial intelligence and the energy transition, all scaling up at once. They draw on the same scarce inputs – skilled workers, metals and materials, energy and, above all, funding. Three vast programmes bidding for limited resources causes their costs to rise. That is inflationary by design. Governments cannot foot the bill: global public debt is near 94% of GDP and headed past 100% this decade, while interest costs have jumped from roughly 2% to nearly 3% of GDP in four years. The burden falls on the private sector and on bond markets, which is why term premia and long-end yields keep grinding higher. For central banks, the conclusion is one-directional: a bias to tighten, or at least to stop cutting. This happens in an economic cycle already running at different speeds: the US resilient yet running a hot economy, Europe sluggish, China still exporting overcapacity. A complex, but largely different, secular cycle than the Debt Supercycle is unfolding in the background.
AI is the boom wearing seemingly “bubbly clothes”, and it sits at the centre of this macro story. Cloud-infrastructure spending has reached around 2% of US GDP, on course to be the largest build-out in US history (even compared to the historical railway boom!); revenues and backlogs are climbing fast and the spillovers are global. But much of it is feeding itself. One firm’s spending is another firm’s revenue: the big platforms fund data centres, lift their suppliers’ sales, then book revenue again by taking equity stakes in the same customers and cross-committing to multi-year orders. Taking that into account, close to 85% of the sector’s revenue is internal recycling of capex, as highlighted by TS Lombard[1] and our own research[2]. Interestingly, this internal capex recycling is even creeping higher, rather than falling as a maturing business should.
The much-cited shortages of chips, memory and power are the mirror image: demand looks insatiable largely because the insiders are the buyers. There is even a name for the latest twist: “Tokenmaxximization,” nudging staff to burn through tokens to manufacture demand from within.
We think that two tests decide whether this is durable investment or expensive excess. First, outside money: the industry must eventually be paid by genuine end-users beyond the AI club. The sector needs a consumer and corporate paid subscription basis. Second, real productivity growth needs to happen as a result, and investing firms need to able capture it for the economics to work. We are not calling the top; momentum is enormous. But the mood rhymes more with the late-1990s build-up than the bust that followed, and two old warning lights are starting to flash: a pipeline of large IPOs, historically the moment insiders cash out, and a rate cycle turning from cuts towards hikes. Heavy issuance into tightening money is the pairing that has ended previous booms. We become wary when debt gets involved over equity funding or off balance sheet items become opaque.
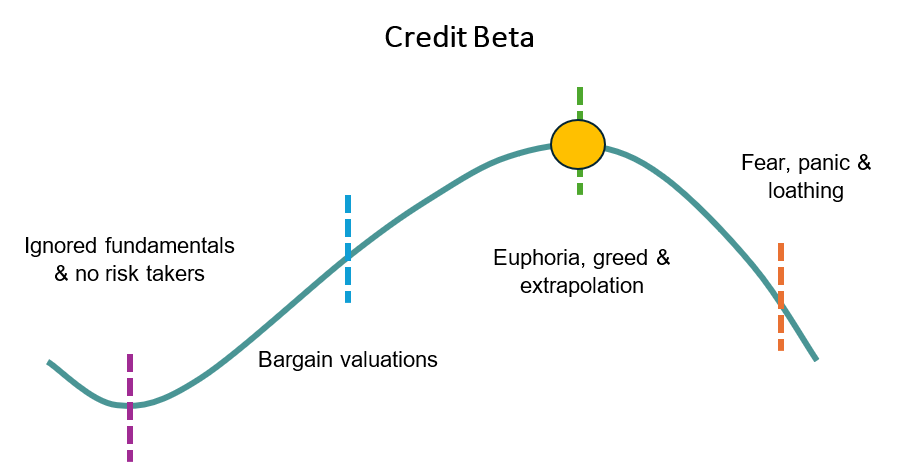
That frames the question we ask every quarter. The Fed usually ends the cycle: across a dozen tightening cycles since the 1950s, most produced a recession within two years – the break landing on whatever imbalance the boom created. So, where is the imbalance, and is it big enough to tip the system over? The answer lies on the K-shape: strong balance sheets, pricing power and cheap funding on the rising arm; higher rates, weak demand and too much debt on the falling one. Averages flatter while the gap widens, and that divergence is where both the opportunities and the accidents live.
Fundamentals – Corporates
It is worth being precise about where the leverage sits, because the answer is reassuring for companies and worrying for governments and private credit. In public corporate credit there is in generally no leverage cycle. Debt remains high, but is being worked down, not piled on. US non-financial corporate debt is near 72% of GDP and the euro area near 103%, both below their 2020 peaks, though the US remains elevated by its own history.
Earnings-based leverage says the same, with one telling detail – the gap between net and gross. On the broad equity indices, US net debt/EBITDA is about 1.9x, right on its seventeen-year median, while gross debt/EBITDA is near 3.8x, close to a seventeen-year low. That gap is cash. Companies look comfortable on a net basis because they hold large cash balances against their debt, but the stock that must be refinanced is being flattered by it. As cash is spent, or as cheap debt rolls into a higher-rate world, net converges on gross and the comfort fades a bit.
Europe is more levered on every measure, 103% versus 72%, 3.1x net versus 1.9x, and structurally so, leaning on bank debt where the US uses more equity. That sharpens the macro warning: a bank-financed, more geared corporate sector is far more sensitive to the rate rises the ECB is now delivering. None of this is acute. The risk is not fresh borrowing; it is a still high stock of debt rolling over against higher rates for the first time in fifteen years.
Valuation
Our rule of thumb has not moved: tight spreads are riskier than wide ones. Easy to say, easy to forget when carry is king and markets are calm. Today almost everything is rich. Most of the credit market trades inside the cheapest quarter of its own history, at around three-quarters of its long-run median spread. Subordinated paper is the same; weaker European sovereigns have widened a touch since the Iran conflict but remain far from stress and still underprice the debt-sustainability risk we see building. We also do not prefer long end US corporate debt, which offer in some instances the same spread as ten-year bonds. The lone real exception is US CCC, the riskiest sliver of high yield. It remains well off its tights, which may serve as a warning sign.
The opportunities are in Emerging Markets, where growth is real. Examples are the banking scenes in Poland or Mexico. Also, several special situations offer value. The bottom end of the K offers an increasing amount of opportunities. Corporates that entered this cycle with too much debt, became victims of Chinese dumping practices or rapid changes in the price of feed stock and offtake markets in chemicals.
Another positive point is that we acknowledge carry is important now – captured through roll down along the curve, slowly deleveraging lower rated credit or just the opposite, covered bonds. Smart portfolio construction and being a bit more creative is becoming increasingly important.
Technicals
What really moves credit here is confidence. Specifically, whether borrowers can keep refinancing. While investors are happy to roll debt over, heavy issuance is absorbed with ease, and that can run for a long time. It is running now: order books are oversubscribed and new-issue concessions are minimal. The cracks to watch are in two corners: Business Development Companies (BDC) in private credit, where redemption pressure and payment-in-kind loans are building, and US CCCs at the bottom of the public market. One structural technical genuinely supports high grade: scarcity. Companies are deleveraging while governments issue ever more, so good corporate paper is relatively scarce against a flood of government bonds.
A word on liquidity. The Fed has restarted modest bond buying, but the pace is not outrunning the economy; its balance sheet and the money supply are both growing roughly in line with nominal GDP. So monetary liquidity is not, on its own, the powerful tailwind for US credit some assume; confidence and the refinancing cycle matter far more. Euro liquidity continues to tighten as the ECB lets its balance sheet shrink in size.
Do geopolitics really matter? Markets reliably lose interest in geopolitical shocks in the matter of a few days or weeks, and the near-term effects tend to be exaggerated. The Iran conflict is no exception there. For markets, the Iran conflict is largely spent as a theme, even if hostilities flare again. We think it is more a symptom of the Yield Era, scarce energy and contested resources, than as a fresh standalone driver.
Positioning
We hold neutral betas across our strategies and focus on what we control: avoiding defaults, picking the right bonds with the right fundamentals, yet offering still a large (enough) margin of safety.
In the Global Credit strategy, we are cautious on banks and own them through the safest senior bonds, with some selective Lower Tier 2 and AT1 positions that are well researched bottom-up and offering a margin of safety. We are neutral on technology, with a quality bias and little exposure to the big AI names, and we hold no BDCs (the private-credit funds where we see stress building). Instead, we are overweight covered bonds, consumer non-cyclicals and communications, steady sectors that tend to hold up when markets wobble. Equally, in line with the Yield-Era we are looking for more interesting yield opportunities in high quality emerging issuers and some interesting cross-over issuers where the margin of safety is appealing while having improving fundamentals.
In the Global High Yield strategy, we are light on the cyclical, technology and energy sectors, and heavier on basic industry and communications, based on bottom-up picks. In chemicals, we think the China dumping risk is now largely in the price, equally so for the Iran conflict. On ratings, we lean towards BB and away from the weakest CCC and B names, sitting well under our 5% CCC limit. If spreads widen, that quality tilt should work (and partially is working as CCC’s continue to slowly grind wider). As a balance, we own several credits that have exited a default or restructuring scenario. Relieved of too much debt, many of these companies get a fresh start. Sometimes one can then buy good companies that used to have too much debt but are still a bit under researched by the market.
Across the whole book the idea is the same, and it follows the K-shape: own the strong side, avoid the weak one. We prefer companies that offer sufficient spread (margin of safety) with solid or improving balance sheets that can keep funding themselves in a tougher market, and we take risk through duration, country risk or position in the capital structure rather than through fragile businesses. That is the right arm of the K to be on.
Conclusion
The Yield Era is the backdrop, and the triple capex boom is the engine. Defense, AI and the transition are all real, all large, and all bidding for the same scarce capital, labour, energy and materials, which keeps inflation sticky and pushes central banks towards tightening or refraining them from cutting. The Fed pivot is the signal that the easy-money chapter is genuinely closed. AI is the boom to watch. Until outside revenue and real productivity show up, much of it is money going round in a circle, “Tokenmaxximization” writ large. With a wave of IPOs and a turning rate cycle arriving together, the old warning lights are on, even if the precise top is impossible to call.
For credit, the message is calm and consistent. Valuations are tight almost everywhere except US CCC. Company balance sheets are healthy and deleveraging, while the real leverage sits with governments and in private credit. We do not need to predict the exact shock; we only know underwriting is poor in spots and the cushion in spreads is thin. So we wait, we collect the income, we stay on the upper arm of the K, and we keep our powder dry in beta terms. When the repricing comes, we will act on research and a margin of safety. We continue to be creative in stock picking, nurture the carry and search for credits that turned the corner. Stock picking it is!
Credit Quarterly Outlook: Where are we in the Cycle
[1] “The Big AI Capex Debate”, Dario Perkins, 4 June 2026, TS Lombard
[2] “A Credit Perspective on AI Infrastructure Accounting”, A Credit Perspective on AI Infrastructure Accounting – Osmosis NL
Download as PDF:
Important Information
Osmosis Investment Management NL B.V. (Osmosis NL) is licensed as an Alternative Investment Fund Manager (AIFM) under the Alternative Investment Fund Managers Directive (AIFMD) and the Dutch Financial Supervision Act (Wet op het financieel toezicht, Wft) and authorized to provide discretionary portfolio management services. Osmosis NL is subject to supervision by the Dutch Authority for the Financial Markets (AFM).
This document and any marketing communication are intended solely for Professional Investors as defined in the Wft. It is not directed at, nor intended for distribution to, any person in any jurisdiction where such distribution would be unlawful.
The information provided is for general information purposes only and does not constitute investment advice, a recommendation, research or an offer or solicitation to buy or sell any financial instrument. It is not tailored to individual circumstances or investment objectives.
The views expressed are as of the date of publication of this document and may change without notice. Although this information is obtained from sources believed to be reliable, no representation or warranty is made as to its accuracy or completeness. Osmosis NL accepts no liability for any direct or indirect loss arising from use of this information.
Past performance is not a reliable indicator of future results. No representation or warranty is made that any account or investment will achieve results similar to those shown. Actual results may differ substantially due to factors such as market conditions, timing and pricing of trades, portfolio composition, fees, and client circumstances. Investments can fall as well as rise in value and may result in the loss of capital. Forecasts, projections, or targets are for illustrative purposes only and are not guaranteed in any way.
Any investment examples included herein are for illustrative purposes only and do not constitute a recommendation to buy or sell any specific security. There is no assurance that such investments will remain in the strategy or have ever been held. Case studies have been selected on a non-performance basis as indicative of the investment approach and process.
Benchmark information is provided for comparison purposes only. Indices are unmanaged, not available for direct investment, and do not reflect the deduction of fees or expenses, which would reduce returns. Past benchmark performance is not a reliable indicator of future results, and the referenced benchmarks may not be appropriate for all investors.
If reference is made to an investment fund, please refer to the relevant fund’s prospectus or offering documents with more details on investment objectives, costs, and risks before making any final investment decisions.
Scenarios and performance presented are estimates based on past data and current market conditions and are not exact indicators of future results. Actual outcomes will vary depending on market performance and the duration of investment.
Clients are encouraged to consult their own legal, tax, accounting, and other professional advisers before making investment decisions and to promptly inform Osmosis NL of any changes to their investment objectives or financial situation.
For Australian Investors: Osmosis NL is a Corporate Authorised Representative (CAR 001316961) of Eminence Global Asset Management Pty Ltd (EGAM) (AFSL holder 305573). Where Osmosis NL provides financial services in Australia, it does so as an authorised representative on behalf of EGAM. The information and materials contained in this document have been prepared for accredited wholesale clients only, as defined by the Corporations Act 2001 (Cth) and in accepting the content of this document, you warrant that you are such an investor.