

Q2 Market Review – July 2026
Patrick Bawlf, Peter Kwaak, Mariia Kuznetcova, Reinout Schapers, Victor Verberk
Market Developments
In our Credit Quarterly Outlook from March 2026, “Death by a thousand cuts”, we argued that no single risk factor was sufficient to derail credit markets alone, but that their accumulated weight — AI excess, private credit stress, sovereign debt fragility, and geopolitical escalation — created conditions for meaningful repricing. With credit spreads still near their historical lows, we held neutral beta, a quality bias, and underweight positions in CCC-rated and long-dated corporate bonds.
Q2 opened with a sharp risk-off move in April as the Iran conflict weighed on energy prices and supply chain sentiment, pushing spreads wider across both investment-grade and high-yield credit. However, markets staged a strong and sustained recovery through May and June. The reversal was driven by resilient US corporate earnings, easing Middle East risk premium as hostilities stabilised, and robust primary market demand that demonstrated investor willingness to deploy capital at wider levels. By quarter-end, spreads had tightened through April’s starting point in most segments — global investment grade ended the quarter at approximately 79 bps, just off the tights of mid-June. High yield ended at 276 bps, having bottomed at 262. Only CCC-rated bonds have been widening considerably despite the strong market overall, as rising rates in combination with weak fundamentals increase the risk of near-term default.
Primary market volumes were exceptional throughout the quarter. IG issuance rose 75% year-on-year in April alone, with full-year 2026 IG supply revised up to a projected record $1.9 trillion by late June. Technology led all sectors with $135 billion year-to-date through Q2, driven by AI data centre funding. Order books were oversubscribed throughout, with new-issue concessions minimal. The sentiment around AI remains strong both in credit markets and equity markets. The successful $75 billion IPO of SpaceX in June was a clear example of this. OpenAI and Anthropic are widely expected to come to the equity market later this year.
Both the Federal Reserve and ECB held rates unchanged throughout Q2. The Fed’s guidance remained consistent with a higher-for-longer stance as services inflation and tariff pass-through continued to complicate the disinflation path. The ECB similarly stayed on hold while allowing its balance sheet to continue shrinking. Rate cuts moved out of the near-term base case for both regions; rate hikes remained a tail risk rather than a central scenario. The net effect was a bear-steepening of yield curves that provided a partial headwind to IG duration performance, even as spread compression drove total returns positive. Long-dated Treasuries peaked above 5% in June.
In the end the move in spread was insufficient to make meaningful changes to the overall beta position in our credit portfolios. Instead, we added in sectors, such as packaging, where spreads widened significantly because of the Iran conflict.
Performance
Q2 2026 was positive across all major credit segments. After a difficult April — in which spreads widened on Iran-related fears and geopolitical uncertainty — credit markets recovered emphatically in May and June. Spread compression was the dominant performance driver: US high yield tightened 34 bps over the quarter, Pan-European high yield 41 bps, US investment grade 10 bps, and EUR investment grade 15 bps. High yield total returns for Q2 reached 2.4% in the US and 3.63% in Europe. Investment grade returned approximately 1.40% in the US and 2.78% in Europe. The outperformance in total returns for European indices was driven by the underlying difference in treasury returns. Excess returns were close to each other across regions at approximately 2.1% in high yield and 1.1% in investment grade.
Portfolio Performance vs. Benchmark (USD Hedged, gross of fees)
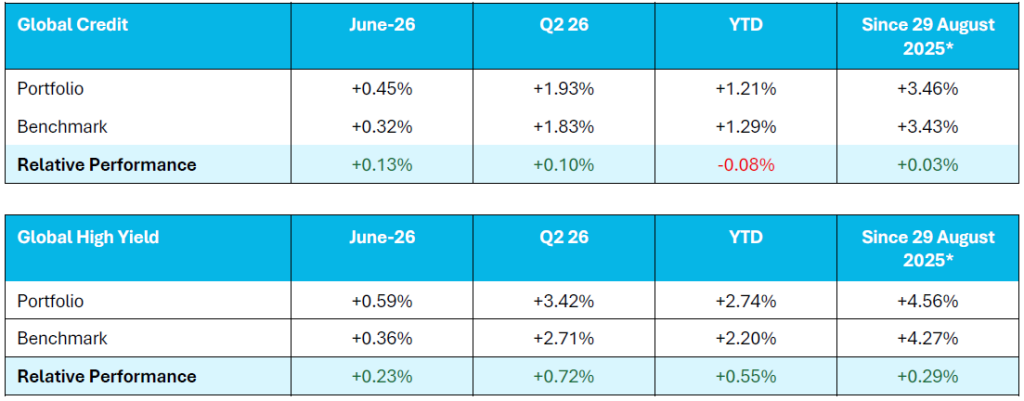
*Fund launch date was 2 July 2025. Performance is shown from 29 August 2025, the date on which the portfolios were fully invested following the initial ramp-up period. During the ramp-up period (from 2 July until 28 August 2025) the funds incurred elevated transaction costs and were not fully invested relative to the benchmark; performance over that period was not representative of the investment strategy and is available upon request. Returns for periods shown are cumulative and not annualised. Performance shown covers a period of less than 12 months and is therefore of limited informative value.
Both portfolios outperformed their benchmarks over the quarter (USD hedged, gross of fees). The primary source of outperformance was issuer selection1, in high yield both by names we own and names we don’t own. Altice USA (+14.2 bps) and Thames Water (+8.6 bps) are names we do not own in our portfolios and are examples of “winning by not losing”. Both are in or close to restructuring. Aquarian Holding (+8.6 bps), a Bermuda-based insurance company, recovered from earlier fears of exposure to private credit. Orbia (+5.2 bps), Warner Bros. Discovery (+2.8 bps) and Paramount (+2.6 bps) were other meaningful contributors. Algoma Steel (+2.8 bps) is an example of a transition story adding to performance (Algoma Steel: How a large polluter can drive the sustainability transition). The main detractors were Baffinland Mining (−8.3 bps), where operational challenges at the Canadian iron ore producer weighed on its bonds. We exited the position as the main thesis no longer held. Outbrain (−5.6 bps), Mobico (−3.9 bps) and Transocean (−2.4 bps) also detracted.
In Global Credit, Warner Bros. Discovery (+6.1 bps) and Paramount (+2.6 bps) together were the largest contributors. Orbia (+4.0 bps) tightened significantly as the Iran war led to materially higher PVC prices benefitting the company. We took profit as spreads normalised and we are cognisant that chemicals remains a high-emitting sector. Polish banking names — PKO Bank Polski (+1.5 bps) and Bank Polska Kasa (+1.2 bps) — both outperformed as the market recognised the strong domestic fundamentals for these Polish banks. Mobico (−2.0 bps) and Comcast (−2.0 bps) were the main detractors in Global Credit; Stellantis (−1.1 bps) and Southern California Edison (−1.0 bps) also weighed on results.
Company & Sector News
The second quarter was mostly driven by top-down issues around the Iran war and inflation. Higher energy prices on the one hand caused energy-intensive sectors such as packaging to underperform, while chemical companies benefitted from substantially higher prices across almost all end markets. Company-specific news was limited or at least in most cases not noteworthy enough. Primary market activity was the defining feature of Q2. Technology dominated Q2 supply on both the IG and HY sides. Alphabet and Meta both raised capital spending projections, increasing the likelihood of incremental bond issuance for data centre buildouts. Dell sold bonds in three parts in June, its first offering since September 2025. In HY, CoreWeave sold $1.75 billion at 9.75% following its new AI computing deal with Meta. We remain cautious about these issues as valuation does not seem to price in the risky nature of the investments in AI, data centres, etc., as we wrote in our recent piece: “Venture capital risks wrapped in investment grade”. Demand for these companies remains healthy nevertheless, also fed by the optimism in equity markets as witnessed by the stellar success of the SpaceX IPO in June. During the quarter, Paramount issued loans to finance the acquisition of Warner Bros. Discovery. This is the first part of the acquisition financing, and we expect the remainder of the financing via secured and unsecured bonds to take place in the next few months.
Business Development Companies (BDCs) and other private credit vehicles remained under persistent pressure throughout Q2. Tail risks from BDC liquidity concerns and stress in software-heavy private credit portfolios remain top of mind as more news came out about BDCs limiting redemptions after large redemption requests by investors. Surprisingly, there remains appetite for bonds issued by these same BDCs, such as Blue Owl, Blackstone or Ares. We have done some analysis on this segment and concluded that at this stage we are not comfortable taking risk.
The US HY default rate rose from 0.78% in October 2025 to 2.01% by April 2026, approaching but still below the 10-year average of 2.31%. We see more companies trying to restructure or move toward default going forward. Given weak covenants on bonds issued in the past few years, recovery values are bound to disappoint. This can be witnessed in the ongoing case of Altice USA, where bondholders are trying to keep the owner from taking assets out of the restricted group to enforce more favourable terms in the restructuring.
Q3 Outlook
The Yield Era is the backdrop: high government debt, persistent deficits, and a triple capex boom in defence, AI, and energy transition keep inflation sticky and central banks biased toward tightening rather than cutting. Returns now come primarily from the income collected, not from falling rates or spread tightening.
AI sits at the center of this macro story. Cloud infrastructure spending has reached approximately 2% of US GDP — on course to be the largest build-out in US history. Revenues and order backlogs are climbing fast, but an estimated 85% of the sector’s revenue is internal recycling of capex between the big platforms, their suppliers, and their customers. Until genuine outside paying revenue and real productivity gains show up at scale, the economic foundation is fragile. Two warning signals are present: a pipeline of large IPOs (historically the moment insiders cash out) and a rate cycle turning from cuts toward hikes. Heavy issuance into tightening money is the combination that has ended previous booms.
In public corporate credit, there is no leverage cycle. US non-financial corporate debt is near 72% of GDP and below its 2020 peak; companies continue to deleverage. The leverage sits on sovereign balance sheets — global public debt near 94% of GDP and rising — and in private credit, which has grown from $1 trillion in 2015 to $2.5 trillion on deteriorating underwriting standards. BDC portfolios show PIK loan exposure near post-COVID highs. One structural technical does support high-grade: scarcity. Companies are deleveraging while governments issue ever more, so high-quality corporate paper is relatively scarce versus a flood of government bonds.
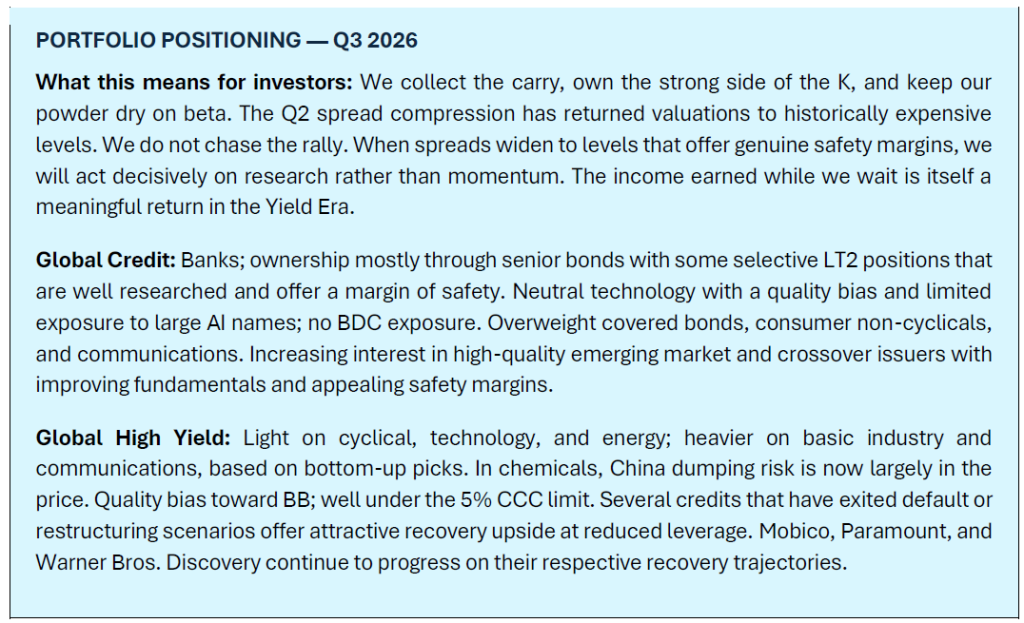
Valuations, having compressed sharply through Q2, offer very little cushion. Almost everything in credit trades inside the cheapest quarter of its own history. US CCC remains the lone real exception, still off its tights — which may itself be a warning sign. We collect the carry, own the strong side of the K in terms of stock selection, and keep powder dry on beta. When the repricing comes, we will act on research and safety margin, not momentum.
Q3 Credit Quarterly Outlook — ‘Tokenmaxximization’
Download as PDF:
Important Information
Osmosis Investment Management NL B.V. (Osmosis NL) is licensed as an Alternative Investment Fund Manager (AIFM) under the Alternative Investment Fund Managers Directive (AIFMD) and the Dutch Financial Supervision Act (Wet op het financieel toezicht, Wft) and authorized to provide discretionary portfolio management services. Osmosis NL is subject to supervision by the Dutch Authority for the Financial Markets (AFM).
This document and any marketing communication are intended solely for Professional Investors as defined in the Wft. It is not directed at, nor intended for distribution to, any person in any jurisdiction where such distribution would be unlawful.
The information provided is for general information purposes only and does not constitute investment advice, a recommendation, research or an offer or solicitation to buy or sell any financial instrument. It is not tailored to individual circumstances or investment objectives.
The views expressed are as of the date of publication of this document and may change without notice. Although this information is obtained from sources believed to be reliable, no representation or warranty is made as to its accuracy or completeness. Osmosis NL accepts no liability for any direct or indirect loss arising from use of this information. Past performance is not a reliable indicator of future results. No representation or warranty is made that any account or investment will achieve results similar to those shown. Actual results may differ substantially due to factors such as market conditions, timing and pricing of trades, portfolio composition, fees, and client circumstances. Investments can fall as well as rise in value and may result in the loss of capital. Forecasts, projections, or targets are for illustrative purposes only and are not guaranteed in any way.
Any investments included herein are for explanatory purposes and do not constitute a recommendation to buy or sell any specific security. There is no assurance that such investments will remain in the strategy
Benchmark information is provided for comparison purposes only. Indices are unmanaged, not available for direct investment, and do not reflect the deduction of fees or expenses, which would reduce returns. Past benchmark performance is not a reliable indicator of future results, and the referenced benchmarks may not be appropriate for all investors.
If reference is made to an investment fund, please refer to the relevant fund’s prospectus, UCITS KIID or offering documents with more details on investment objectives, costs, and risks before making any final investment decisions. Scenarios and performance presented are estimates based on past data and current market conditions and are not exact indicators of future results. Actual outcomes will vary depending on market performance and the duration of investment.
Clients are encouraged to consult their own legal, tax, accounting, and other professional advisers before making investment decisions and to promptly inform Osmosis NL of any changes to their investment objectives or financial situation.
For Australian Investors: Osmosis NL is a Corporate Authorised Representative (CAR 001316961) of Eminence Global Asset Management Pty Ltd (EGAM) (AFSL holder 305573). Where Osmosis NL provides financial services in Australia, it does so as an authorised representative on behalf of EGAM. The information and materials contained in this document have been prepared for wholesale clients only, as defined by the Corporations Act 2001 (Cth) and in accepting the content of this document, you warrant that you are such an investor.
- Source: Bloomberg Port per end of June 2026 ↩︎