


Crowding Out
By Victor Verberk, CEO/CIO and Bob Stoutjesdijk, Strategist
The Osmosis Fixed Income Team has experienced many credit-market cycles, both upturns and downturns. Since the early 2000s, the starting point of our process has been – and will remain – a thorough review of the credit-market cycle.
Crowding Out
Quick Read:
- Capital is scarce and expensive again. The coupon is the return, and the ability to refinance decides who keeps it.
- Three investment programmes are being funded at once, and their competition for the same inputs keeps inflation high.
- Governments can no longer carry the bill, so it passes to the bond market and is allocated by price. That is crowding out.
- Sovereign refinancing is getting more expensive, France most of all, and it limits what central banks can do about inflation.
- Size is now a fundamental. The largest borrowers face almost no extra interest cost; smaller ones face all of it.
- Spreads pay for none of this, so we stay neutral in beta, collect the income and pick our names.
Fundamentals – Economics
Capital used to be plentiful and steadily cheaper during the Debt Supercycle. It is now scarce and steadily more expensive. We call this the Yield Era. Its causes are structural rather than cyclical: high government debt, deficits that no longer close, shrinking workforces, a more divided world, and an investment bill of a size we have not seen in decades. Three of those investments are being made at once. The energy transition, defence and artificial intelligence compete for the same scarce inputs: engineers, metals, power and, above all, capital. That competition raises the cost of each of them. It is why this expansion pushes prices up, and why the term premium has returned.
The consequence for investors follows directly. Return now comes from the coupon, not from falling yields. Two things threaten that coupon: a borrower who cannot refinance, and the competition for funding between governments and the private sector. Government debt worldwide is close to 94% of GDP and is set to reach 100% by 2029. The interest bill has risen from roughly 2% to almost 3% of global GDP in four years and continues to rise at a steep pace, compounding the problem.1 That is what we mean by crowding out.
Let’s start with the price of money. Yields have risen again this year in the eurozone, the United Kingdom, the United States and Japan, and long-term yields in advanced economies are at multidecade highs.1 Japan is the clearest break: after two decades near zero, the Bank of Japan has been raising rates2, and long yields have followed. Governments feel this as much as companies do, because old debt is eventually replaced by new debt. We calculated what this means for each country.3 If all government debt were refinanced at today’s market rates, Germany’s average interest cost would rise by about two percentage points. France’s would rise by about 1.75 points, and Spain’s and Greece’s by about one. Italy would see the smallest increase. Germany would also feel the change sooner, because much of its debt is short-term and comes up for renewal quickly. Italy’s longer maturities give it more time.
Germany can afford that. France cannot. It carries a large debt, a deficit it has not addressed, and a step-up that grows with every year of delay. The market has noticed, and French companies now borrow at spreads much closer to the French state than they used to. Governments and central banks are trying to calm markets. Japan’s Ministry of Finance has intervened in the currency market to support the yen.4 The US Treasury has at least doubled the maximum size of its long-end buyback operations and is keeping coupon auction sizes unchanged, so that additional borrowing falls on short-dated bills.5 In our view, that is a reverse twist: retire long bonds, fund short, hold long yields down. The Bank of England has slowed its gilt sales considerably,6 in our view for similar reasons. This is not housekeeping. It is an attempt to manage a bond market that has become harder to fund. In our view, the US Treasury and Bank of England are showing their cards by taking these actions and openly worrying about the higher yields, which in turn might be a self-fulfilling prophecy pushing yields even higher.
Central banks are caught in the middle. Inflation is above target in the United States, the euro area and the United Kingdom, and in the United States it has been for more than five years.7 It will not fall back on its own, which argues for keeping policy tight; both the Federal Reserve and the ECB raised rates this month.8 But tight policy raises the funding cost of the governments whose deficits are driving part of the inflation overshoot. Selling bonds from their own balance sheets removes the one buyer who never asked about price. Something has to give, and it usually gives in favour of the finance ministry. That is fiscal dominance, and we think it is more likely than the market allows.
Two points complete the picture. Firstly, monetary or liquidity support is not present like it was during the Debt Supercycle. The ECB and the Bank of England are still shrinking their balance sheets, the Federal Reserve is only maintaining ample reserves, and euro area money growth is moderate at 3.5%.9 Liquidity is neutral, or marginally negative, rather than the tailwind we are used to. Secondly, artificial intelligence is not the disinflationary force many expect. We are still in the construction phase, where the costs arrive immediately and the efficiency gains arrive later. The largest cloud providers now spend a multiple of the usual share of revenue on capital expenditure, and circular financing arrangements account for a sizeable share of the sector’s financing and forward revenue.10
Fundamentals – Corporates
There is still no leverage cycle in public corporate credit. Debt is high but falling, and the median company covers its interest comfortably. The average no longer tells you much; the spread around it is the story. That spread is the K: the same interest rates are making the top arm stronger and the bottom arm weaker. Large companies sit on the top arm. US non-financial corporates as a group pay net interest of about USD 200 billion a year, well under 1% of GDP.11 They borrowed long at 2020 and 2021 coupons and earn a similar rate on their cash, so higher rates help them almost as much as they cost them. Their investment grade debt does not mature in size until around 2028, which buys them time.12
Smaller companies sit on the bottom arm. The ECB’s survey on firms’ access to finance still shows bank credit getting harder for small and mid-sized firms to obtain, even as their financing needs rise, while availability for large companies is improving. In the United States, banks report stronger loan demand from large and mid-sized firms, but not from small firms.13 These firms did not fix their funding when it was cheap. They hold far less cash to earn interest on. And they borrow from banks rather than a bond market that wants their paper. Europe is more exposed: more debt, more bank reliance, with real estate and utilities weakest.
Two measures matter here. Leverage is how much debt a company owes. Coverage is whether its earnings pay the interest. In high yield the first is not the problem; debt is slowly coming down. The second is where the Yield Era bites, because coverage falls the moment cheap debt is replaced by expensive debt, whatever the company does. The step depends on the rating. Over the past year new BB paper arrived around 60 basis points above the paper it replaced, new single-B more than 110, and new CCC more than 200. Two thirds of the index must refinance within five years, and almost all of the increase falls in the first three.12 Investment grade meets the same arithmetic later and more gently, from its 2028 wall and at closer to one and a half to two points. Coverage is improving for BB and single-B and deteriorating for CCC. The K once more.
Valuation
Compensation for risk is poor across most of the market, and we still regard narrow spreads as more risky than wide ones. Most of credit trades in the most expensive quartile of its own history, at roughly three quarters of its median spread.12 Investment grade deserves a closer look, because that is where the tightness is most extreme. The all-in yield is attractive and is the reason to own the asset class. The spread is not. Very little of what you earn is payment for credit risk; the rest is the government curve. The curve does not reward patience either: long-dated US corporates often pay no more than the same issuer’s five- to ten-year paper. We are happy to own the yield and unwilling to pay for the duration. We like BBB/BB rated paper on the belly of the curve where we still see reasonable spreads in a select number of issuers while also benefiting from the high underlying risk-free interest rates. High coupons and high carry on the belly of the curve, from well-researched issuers, are therefore our preferred positioning in the Yield Era.
European government spreads make the point more sharply. France, Italy and Spain all trade close to Germany compared to their own history, while spreads are drifting slowly wider, and companies there trade close to their own sovereigns. Given the debt positions described earlier, that is a thin cushion. It leaves nothing for a failed auction or a political accident, and we are underweight all three.
One spread level cannot describe the lowest-rated part of the market. Our own work on the US high yield index shows why. Over the past year the average CCC spread widened while the median CCC bond tightened, a difference caused almost entirely by a handful of issuers. The category is not deteriorating as a whole; it is separating. Two fifths now trades close to par, at a yield barely above a single-B credit. About one seventh trades near sixty cents, at yields above thirty per cent.12 Migration adds to it. Stronger issuers leave through upgrade or repayment; downgraded single-B borrowers arrive at wider spreads. The record index-average rating reflects turnover, not repair.
Volatility in investment grade and high yield is close to the lowest we have recorded, so spreads price almost none of the risks in this letter. And the equity-bond relationship that supported balanced portfolios for two decades has been positive since 2020, so bonds protect less than the models assume. Value remains in the stronger emerging markets, Mexico and Poland among them, and in a number of special situations.
Technicals
What drives credit here is not valuation but confidence, and specifically whether borrowers can keep refinancing. For now they can. Order books are oversubscribed, new issues come with almost no concession, and large deals are absorbed easily. This can last a long time, and we do not expect it to break this quarter.
The larger issue is supply. Governments, companies and banks are all issuing at once, and governments are issuing by far the most. That combined volume is why long yields and the term premium keep drifting higher. Buyers exist, but they must be paid more to absorb it. This is crowding out in its plainest form, and it raises the cost of money for everyone else. One benefit for us: companies are reducing debt while governments add to it, so good corporate paper is scarce next to a growing pile of government bonds, and scarcity supports high grade.
Two areas need watching. The first is private credit and the loan market, which have taken on the weakest borrowers. Payment-in-kind structures let a company under pressure postpone its cash interest instead of defaulting, so problems surface late. The funds financing this market face redemption pressure, and scrutiny is increasing. Public high yield looks healthier than it is, partly because those borrowers have left it. The second is the distressed end of CCC, for the reasons above.
One change in borrower behaviour matters. Treasurers funded short for two years while they waited for rate cuts. That expectation has faded, and issuers are now extending maturities and fixing coupons. Sensible for them, and more long-dated supply for the market above.
Positioning
Beta is neutral across our strategies and our effort goes into stock picking: avoiding defaults, and buying bonds whose fundamentals justify their spread with a margin of safety left over. What sets this quarter apart is not how much risk we take, but how carefully we separate within it, by quality, by size and by country.
In the Global Credit strategy we favour large, liquid investment grade issuers, combined with well-researched bottom-up positions. Technology is neutral with a quality bias and little exposure to the main AI names, and we hold no listed private-credit vehicles. With spreads on technology issuers now (much) wider, we are slowly getting more enthusiastic on the sector. Consumer non-cyclicals, communications and covered bonds are overweight. We limit concentration in issuers that depend on a strained sovereign, France and Italy in particular, and keep adding high quality emerging market and cross-over credits where fundamentals improve.
The Global High Yield strategy is underweight cyclicals, technology and energy, and overweight basic industry and communications, in each case on bottom-up grounds. We think the risk of Chinese overcapacity in chemicals is largely in the price. We prefer BB to the weaker single-B and CCC categories and operate well inside our 5% CCC limit. Within that category we are selective rather than absent, because the split described earlier creates real opportunity alongside real distress. We also hold issuers that have come through restructuring, whose balance sheets have been repaired while prices do not yet fully reflect that, and whose recovery is often under-researched.
The principle is the same across the book. We want borrowers who can still fund themselves in a harder market. We would rather take risk through duration, country or position in the capital structure than through a fragile business (model).
Conclusion
The Yield Era is the setting and the three investment programmes are the engine. Their claim on the same capital, labour, energy and materials keeps inflation sticky and central banks leaning towards tightening. The defining feature of this market is that capital is rationed by price, which means by higher interest rates. We called this edition Crowding Out for that reason: governments borrow so much that every other borrower pays more. The pressure lands unevenly, and that is the K again. Large companies sit on the top arm, with cheap funding fixed for years ahead. Smaller companies and the weakest ratings sit on the bottom. Governments have least room of all, and their arithmetic now constrains the central banks meant to discipline them.
Very little of this is in the price. Spreads sit in the most expensive quartile of their history, volatility is near its lowest recorded level, and there is little compensation for being wrong. We do not need to know what the shock will be, or when. We can see where the pressure sits. In private credit, where problems surface late. In sovereigns, where the bill is rising faster than the will to address it. And at the bottom of high yield, which has already split into solvent and distressed borrowers. The index average hides all of it, and the letter grade tells you less than it used to. This is a stock picker’s market. We hold beta neutral, collect the income, keep capacity to act, and intend to meet the repricing with research and a margin of safety. There are plenty of interesting names with a specific story, whether M&A, companies in repair after a default or Chapter 11 event, or other special situations where spreads have widened and meet our margin-of-safety criteria.
Credit Quarterly Outlook: Where are we in the Cycle
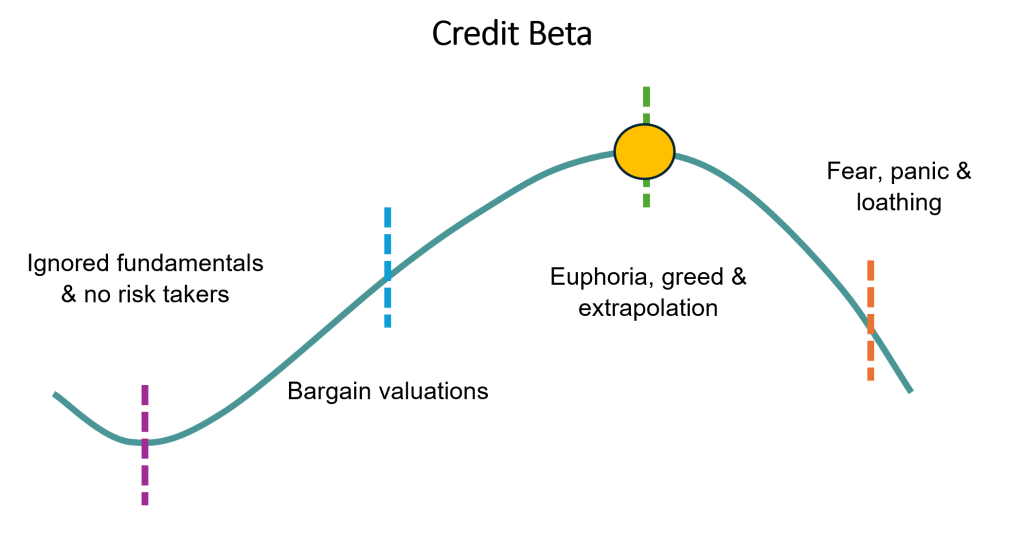
Source: Osmosis NL
Sources
- 1. International Monetary Fund, Fiscal Monitor, April 2026: “Fiscal Policy under Pressure: High Debt, Rising Risks”.
- 2. Bank of Japan, Change in the Guideline for Money Market Operations, 18 September 2026.
- 3. Osmosis NL calculations, based on outstanding government debt and current market yields.
- 4. Ministry of Finance Japan, Foreign Exchange Intervention Operations, 28 April – 27 May 2026; Federal Reserve Bank of New York, Treasury and Federal Reserve Foreign Exchange Operations, Q2 2026.
- 5. U.S. Department of the Treasury, Quarterly Refunding Statement, 5 August 2026; U.S. Department of the Treasury, press release “Treasury Announces Increased Sizes of Nominal Long-End Liquidity Support Buybacks”, 19 August 2026.
- 6. Bank of England, Monetary Policy Summary and Minutes, September 2026.
- 7. U.S. Bureau of Economic Analysis, Personal Income and Outlays, July 2026; Eurostat, euro area annual inflation, 17 September 2026; Bank of England, Monetary Policy Summary and Minutes, September 2026.
- 8. European Central Bank, Monetary policy decisions, 10 September 2026; Federal Reserve, FOMC statement, 16 September 2026.
- 9. European Central Bank, Monetary policy decisions, 10 September 2026, and Monetary developments in the euro area: August 2026; Federal Reserve, FOMC statement, 16 September 2026; Bank of England, Monetary Policy Summary and Minutes, September 2026.
- 10. Bank for International Settlements, Annual Economic Report 2026, Chapter I “Progress and peril”.
- 11. U.S. Bureau of Economic Analysis, National Income and Product Accounts: net interest and miscellaneous payments of nonfinancial corporate business, Q2 2026 (via Federal Reserve Bank of St. Louis, FRED); U.S. Bureau of Economic Analysis, Gross Domestic Product, Q2 2026.
- 12. Osmosis NL calculations based on corporate bond index data.
- 13. European Central Bank, Survey on the Access to Finance of Enterprises in the euro area, Q2 2026; Federal Reserve, Senior Loan Officer Opinion Survey on Bank Lending Practices, July 2026.
Download as PDF:
Important Information
Osmosis Investment Management NL B.V. (Osmosis NL) is licensed as an Alternative Investment Fund Manager (AIFM) under the Alternative Investment Fund Managers Directive (AIFMD) and the Dutch Financial Supervision Act (Wet op het financieel toezicht, Wft) and authorised to provide discretionary portfolio management services. Osmosis NL is subject to supervision by the Dutch Authority for the Financial Markets (AFM).
This document and any marketing communication are intended solely for Professional Investors as defined in the Wft. It is not directed at, nor intended for distribution to, any person in any jurisdiction where such distribution would be unlawful.
The information provided is for general information purposes only and does not constitute investment advice, a recommendation, research or an offer or solicitation to buy or sell any financial instrument. It is not tailored to individual circumstances or investment objectives.
The views expressed are as of the date of publication of this document and may change without notice. Although this information is obtained from sources believed to be reliable, no representation or warranty is made as to its accuracy or completeness. Osmosis NL accepts no liability for any direct or indirect loss arising from use of this information.
Past performance is not a reliable indicator of future results. No representation or warranty is made that any account or investment will achieve results similar to those shown. Actual results may differ substantially due to factors such as market conditions, timing and pricing of trades, portfolio composition, fees, and client circumstances. Investments can fall as well as rise in value and may result in the loss of capital. Forecasts, projections, or targets are for illustrative purposes only and are not guaranteed in any way.
Any investment examples included herein are for illustrative purposes only and do not constitute a recommendation to buy or sell any specific security. There is no assurance that such investments will remain in the strategy or have ever been held. Case studies have been selected on a non-performance basis as indicative of the investment approach and process.
Benchmark information is provided for comparison purposes only. Indices are unmanaged, not available for direct investment, and do not reflect the deduction of fees or expenses, which would reduce returns. Past benchmark performance is not a reliable indicator of future results, and the referenced benchmarks may not be appropriate for all investors.
If reference is made to an investment fund, please refer to the relevant fund’s prospectus or offering documents with more details on investment objectives, costs, and risks before making any final investment decisions.
Scenarios and performance presented are estimates based on past data and current market conditions and are not exact indicators of future results. Actual outcomes will vary depending on market performance and the duration of investment.
Clients are encouraged to consult their own legal, tax, accounting, and other professional advisers before making investment decisions and to promptly inform Osmosis NL of any changes to their investment objectives or financial situation.
For Australian Investors: Osmosis NL is a Corporate Authorised Representative (CAR 001316961) of Eminence Global Asset Management Pty Ltd (EGAM) (AFSL holder 305573). Where Osmosis NL provides financial services in Australia, it does so as an authorised representative on behalf of EGAM. The information and materials contained in this document have been prepared for accredited wholesale clients only, as defined by the Corporations Act 2001 (Cth) and in accepting the content of this document, you warrant that you are such an investor.
Website: www.osmosisim.nl