


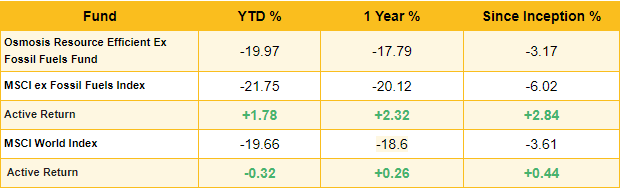
Performance to 31 October 2022 – inception date 28 Feb 2021
Source: Osmosis IM, Bloomberg, Barra LLC’s data were used in the preparation of this report. Copyright 2015 BARRA, LLC. All Rights Reserved
MSCI World is GDDUWI Index, Gross Total Return (USD). Osmosis RE Core Equity ex fossil fuels is a systematic investment strategy created for the purpose of illustrating the effect of excluding fossil fuels and other ethical screens on the Osmosis Core Equity portfolio (Osmosis screens). Returns represent the actual returns for the Core equity (ex-fossil fuels) Fund, Class A. Such returns are net of fees, costs and dividend withholding tax. Different fees apply to each share class and a client’s returns will be reduced by the advisory fee and other expenses incurred in the management of its account. Please see the attached performance calculation disclosure language. Past performance is not an indication of future performance.
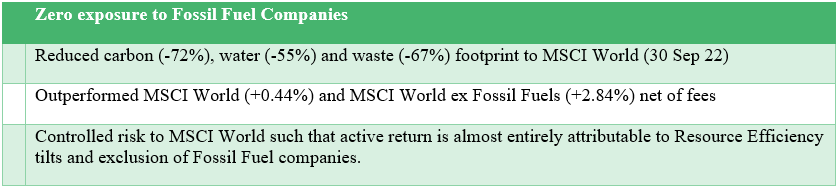
Since its launch the portfolio has successfully delivered on its four key objectives:
The Osmosis Resource Efficient Core Equity (ex-fossil fuels) Fund has returned -3.17% (net of fees) since inception, outperforming the MSCI World by 0.44%. In comparison, the MSCI World ex Fossil-Fuels Index underperformed the MSCI World by -2.40%. The outperformance has been achieved in an environment of rapidly increasing energy stock prices, with the MSCI Energy Sector Index increasing by 78.57% over the same period. The Fund’s success can be attributed to a move away from the traditional market cap-weighted approach which would naturally increase the active weight in the largest sectors and countries. Instead, the risk brought into the portfolio through divestment is reallocated to the most highly correlated companies that remain to match the missing exposures and pushing the risk towards the most resource-efficient companies in the universe. This sophisticated optimisation maintains tight country, industry, and sector exposures to the benchmark avoiding the unintended bet of simply overweighting the technology sector or other ‘ESG’ favourites.
The active return since inception has been derived from two main sources of return.
- The negative industry effect of -1.59% (gross) is almost entirely attributable to the exclusion of the Oil & Gas sector.
- The stock-specific return of+2.13% (gross), attributable to Resource Efficiency, has more than offset the negative industry effect and has been the driver of outperformance within the strategy across EMEA, APAC, and N. America.
“The ability to weather asset price reflation in the energy sector as a result of rising oil prices was one of our primary goals in building the ex-Fossil Fuels strategy. Divestment decisions must be considered in the context of ‘fiduciary duty’ and should not be made at any cost nor undertaken without an awareness of active risk. Our models showed that the additional return derived from targeting Resource Efficient companies across the broader portfolio would help offset any such asset price inflation. Launching the Fund into an unprecedented oil and commodity-based rally, we have been delighted to see the thesis hold true.”
Ben Dear, CEO
Osmosis launched the Resource Efficient Core Ex-Fossil Fuels Fund with a $250 million seed from the IMAS (IKEA) foundation in February 2021. The Fund was developed to offer investors a risk-controlled core portfolio which prohibits investment in companies that generate more than 5% of their revenues from fossil fuels or nuclear power generation, companies with any revenues from nuclear and controversial weapons and civilian firearms, tobacco companies, and companies in breach of any of the UN Global Compact Principles. The Strategy uniquely addresses both the supply side of fossil fuel energy generation through divestment and the demand side through the over and underweighting of companies based on their Resource Efficiency. The strategy is driven by the Osmosis Resource Efficiency factor, which is derived from an objectively-driven research program that measures the World’s leading corporations’ environmental efficiency.
Importantly, companies in the utilities sector that have demonstrated that they have started a meaningful transition path to cleaner energy sources can be reincluded. A smart screen identifies companies with revenues from oil & gas greater than 5% of total revenues, but with greater than 50% energy generation from renewable sources (such as hydroelectric and solar/wind) which can be included in the portfolio, rewarding positive change. Examples include Orsted, EDP, and Consolidated Edison.
Since the Strategy’s inception, a UCITS Common Contractual Fund and an Osmosis Ex-Fossil Fuels Index, against which segregated accounts can be managed, have been launched against the strategy. Total assets have reached USD 484m with East Sussex Pension Fund the latest high-profile client to adopt the strategy.
Sustainable Outcomes
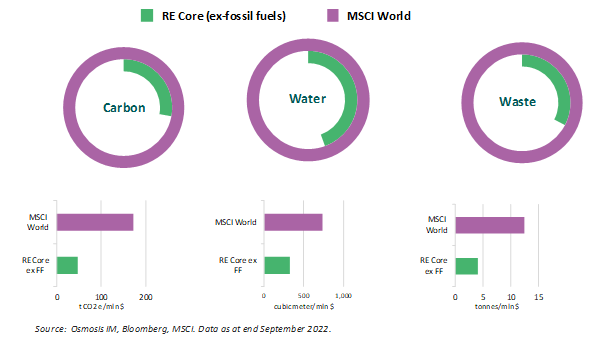
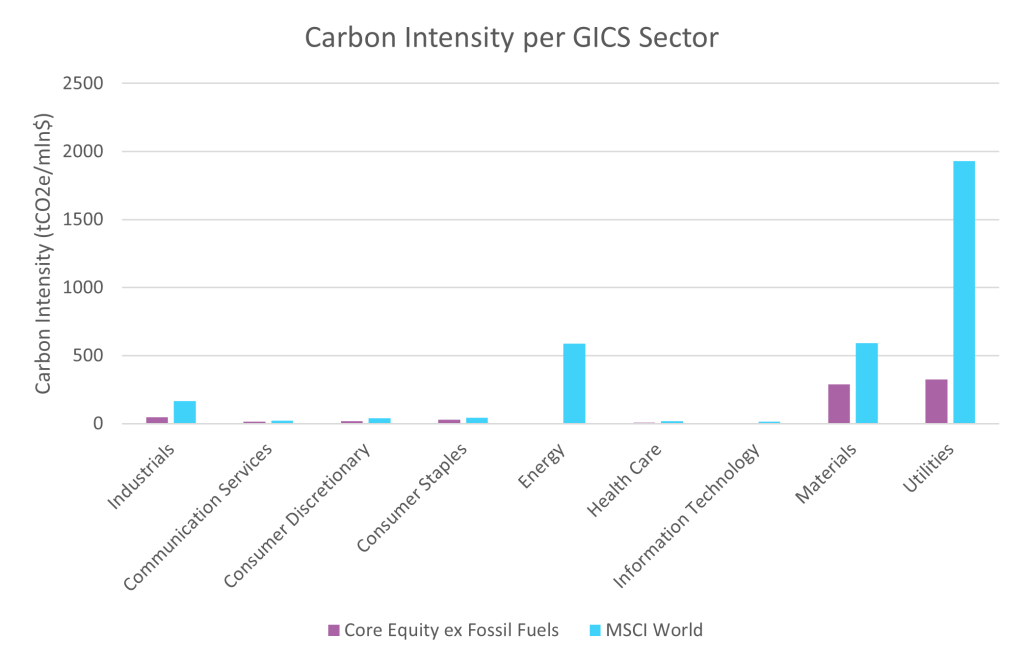
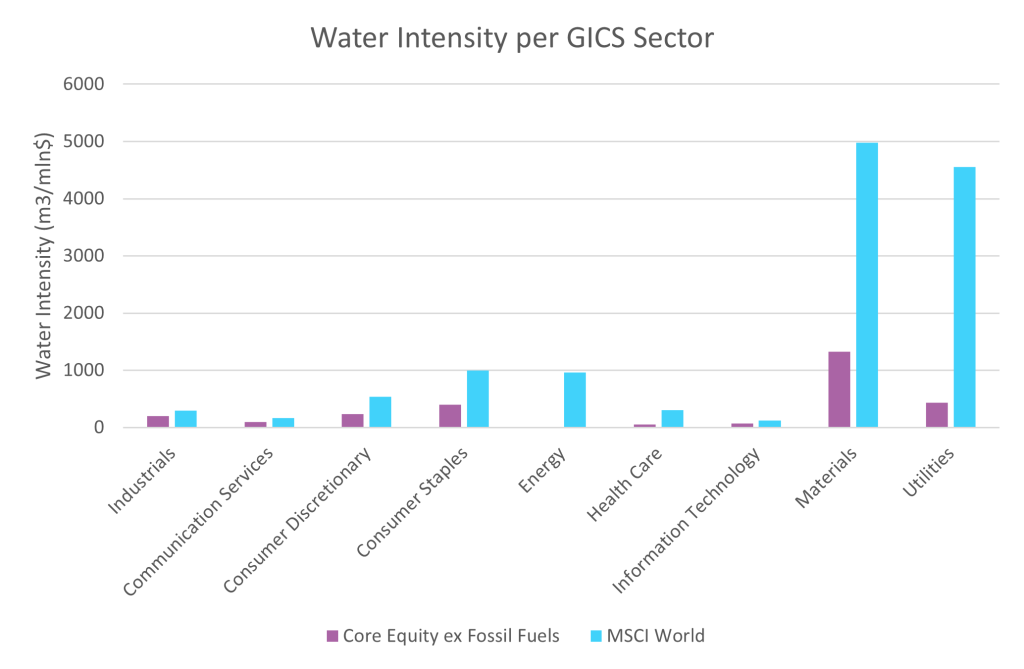
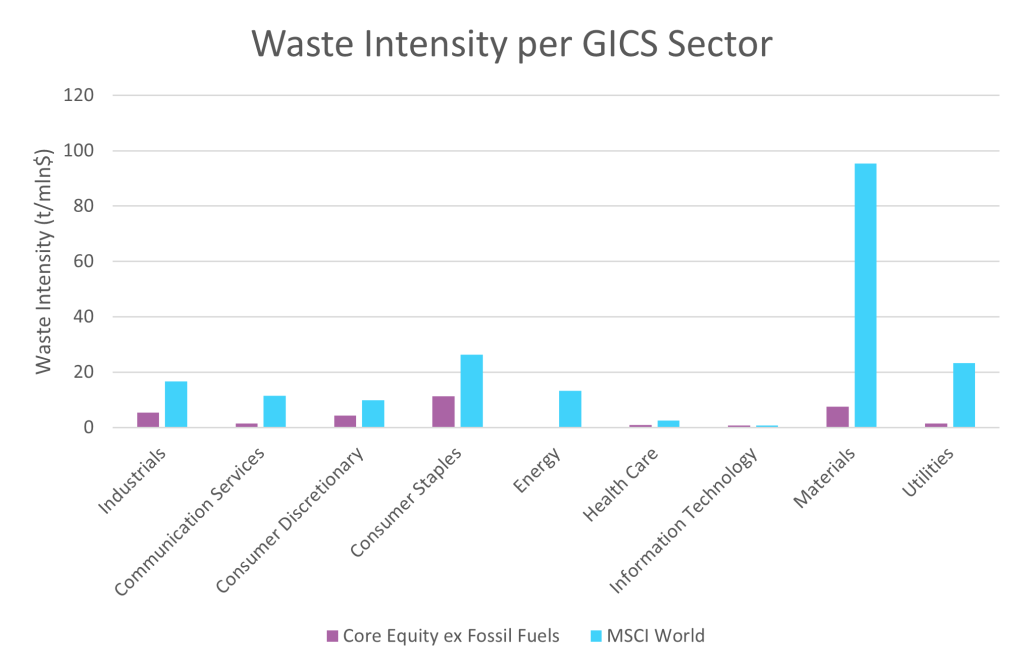
The Osmosis Resource Efficient Core equity (ex-fossil fuels) strategy has a significantly reduced carbon (-72%), water (-55%), and waste (-67%) footprint relative to the underlying MSCI World benchmark. As Resource Efficiency is targeted across the remaining sectors of the economy, we can show the footprint savings across carbon, water, and waste across the whole economy, as can be seen by sector environmental footprints below.
IMPORTANT INFORMATION:
The Core Equity – Ex Fossil Fuel Fund is not available for US Investors. Separate accounts are available for U.S. investors using the same model and investment objective of the Fund.
Investments like these are not suitable for most investors as they are speculative and involve a high degree risk, including risk of loss of capital. There is no assurance that any implied or stated objectives will be met. This material is provided for illustrative purposes only and is for use in one-on-one presentations only.
This document alone does not constitute: a recommendation by, or advice from, Osmosis or any other person to a recipient of this document on the merits or otherwise of participating in the products, investments and transactions referred to in this document; a guarantee, forecast, projection or estimate of any future returns (or cash flows) on any investment; or investment, tax or other advice. Potential investors should read the relevant fund’s prospectus, or offering memorandum, and consult their own legal, tax, accounting and other professional advisers before making any investment. Prospectuses and EEA key investor information documents for the Osmosis Resource Efficient Core Equity Fund are available in English and may be obtained here or by contacting Osmosis’s registered office.
A decision may be taken at any time to terminate the arrangements made for the marketing of the Fund in any EEA Member State in which it is currently marketed. In such circumstances, Shareholders in the affected EEA Member State will be notified of this decision and will be provided with the opportunity to redeem their shareholding in the Fund free of any charges or deductions for at least 30 working days from the date of such notification. As required under sub-paragraph 2 of Article 4(3) of the CBDR.
Performance.
NO REPRESENTATION IS BEING MADE THAT ANY ACCOUNT WILL OR IS LIKELY TO ACHIEVE PROFIT OR LOSSES SIMILAR TO THOSE SHOWN. An investor’s actual account is managed by Osmosis based on the strategy, but the actual composition and performance of the account may differ from those of the strategy due to differences in the timing and prices of trades, and the identity and weightings of securities holdings.
Gross Performance. Gross Returns are gross of fees and in USD unless indicated otherwise. Gross return results do not reflect the deduction of investment advisory fees. Gross performance results may include the reinvestment of dividends and other account earnings. A client’s return will be reduced by the advisory fees and other expenses it may incur as a client. For example, the deduction of a 1% advisory fee over a 10-year period would reduce a 10% gross return to an 8.9% net return. Please see the specific performance disclosure under each slide for additional details. Our fees are fully disclosed in our Part 2A of Form ADV and may be updated from time to time.
Net Performance. Net returns are net of fees and in USD unless indicated otherwise. Net returns are net of fees, costs and dividend withholding tax. Different fees may apply to a client’s account and a client’s returns may be further reduced by the advisory fee and other expenses incurred in the management of its account. Please see the specific performance disclosure under each slide for additional details. Our fees are fully disclosed in our Part 2A of Form ADV and may be updated from time to time.
Past performance may not be indicative of future results. Different types of investments and/or investment strategies involve varying levels of risk, and there can be no assurance that any specific investment or investment strategy will be profitable. Changes in exchange rates may have an adverse effect on the value price or income of the product. No current or prospective client should assume that future performance will be profitable, equal the performance results reflected, or equal any corresponding historical benchmark index. For reasons including variances in fees, differing client investment objectives and/or risk tolerance, market fluctuation, the date on which a client engaged Osmosis’s services, and any account contributions or withdrawals, the performance of a specific client’s account may have varied substantially from the referenced performance results. In the event that there has been a change in a client’s investment objectives or financial situation, the client is encouraged to advise us immediately. It is important to remember that the value of investments, and the income from them, can go down as well as up and is not guaranteed and that you, the investor, may not get back the amount originally invested. Any forecast, projection or target where provided is indicative only and is not guaranteed in any way. Osmosis accepts no liability for any failure to meet such forecast, projection or target. Past performance is not an indication of future performance.
Investment Examples. The investment examples set forth in this presentation should not be considered a recommendation to buy or sell any specific securities. There can be no assurance that such investments will remain in the strategy or have ever been held in the strategy. The case studies have been selected to be included in this presentation based upon an objective non-performance basis because we believe these are indicative of our strategy and investment process. Nothing herein shall be deemed to limit the investment strategies or investment opportunities to be pursued by Osmosis.
Information pertaining to Osmosis’s advisory operations, services, and fees are set forth in Osmosis’s current disclosure statement (Form ADV Part 2A), a copy of which is available from Osmosis upon request and from the SEC at http://www.adviserinfo.sec.gov./Information regarding OHL is available from us upon request.
Benchmarks. The historical index performance results for all benchmark indexes do not reflect the deduction of transaction, custodial, or management fees, the incurrence of which would have the effect of decreasing indicated historical performance results. Indexes are unmanaged and are not available for direct investment. The historical performance results for all indices are provided exclusively for comparison purposes only and may or may not be an appropriate measure to provide general comparative information to assist an individual client or prospective client in determining whether Osmosis performance meets, or continues to meet, his/her investment objective(s). The referenced benchmarks may or may not be appropriate benchmarks against which an observer should compare our returns.
The MSCI World Index captures large and midcap representation across 23 Developed Markets countries. With 1,645 constituents, the index covers approximately 85% of the free float-adjusted market capitalization in each country.
The MSCI World ex Fossil Fuels Index is based on the MSCI World Index, its parent index, and includes large and mid-cap stocks across 23 Developed Markets (DM) countries*. The index represents the performance of the broad market while excluding companies that own oil, gas, and coal reserves.