Carbon Emissions Trading Systems
In May 2021, the UK auctioned the first allowances under its own Emission Trading System (UK ETS), which went live in January, replacing the EU ETS. The establishment of the UK ETS is another sign that countries are increasingly serious about tackling greenhouse gas emissions (GHG).
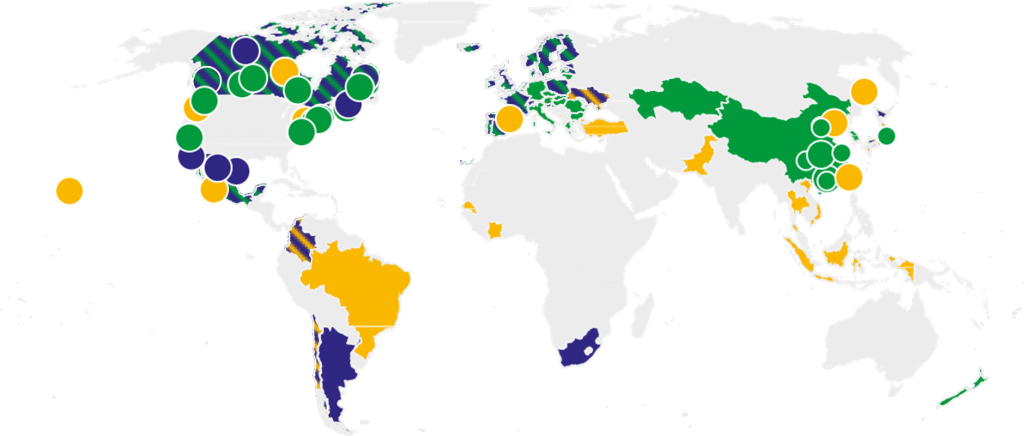
According to the World Bank, there are now 64 carbon pricing mechanisms in place around the world, either in the form of a direct carbon tax or a cap-and-trade system, covering about 20% of global GHG emissions. The EU ETS, one of the world’s largest carbon markets, covers roughly 40% of the EU’s emissions from electricity generation, industrial manufacturing, and aviation. The EU ETS is facing a revamp as part of the European Green Deal with tougher emission limits proposed and more industries to be included in a shift towards stricter climate policies. For instance, the EU plans to include shipping in the scheme – a sector judged notoriously difficult to decarbonise – increasing the pressure on maritime transportation to accelerate its transition to greener technologies.
Summary map of regional, national and subnational carbon pricing initiatives


Scientists recommended that to meet the target of well below 2 degrees Celsius under the Paris Agreement, a carbon price of $40-80/tCO2e (tons of CO2 equivalent) was needed for 2020. Even though the situation has improved sharply in Europe over the last year, most of the world’s carbon prices were far below the required level.

Using Resource Efficiency to assess company resilience to carbon pricing
Utilising the Osmosis Model of Resource Efficiency, a database of proprietary environmental data from 2005 on, we analysed constituents of the MSCI World Index to determine how harshly a portfolio comprised of the least pollutive companies from each sector would be impacted by a materially higher carbon price compared to a portfolio of the most polluting companies in each sector. We determined the environmental footprint of companies based on their combined Resource Efficiency Score (the carbon emitted, waste generated, and water consumed, relative to revenue generated). In each sector, resource efficient companies are, therefore, those which most efficiently use limited resources to create economic value.

A portfolio of the top third of companies in each sector ranked by their Resource Efficiency, and representing nearly 30% of the index’s market cap, currently emits about 633 million tCO2e (based on Scope 1 and 2[1]). In comparison, a portfolio of the bottom third of companies in each sector by Resource Efficiency, amounting to only 15% of the market cap, emits approximately 2.6 times as much at 1.66 billion tCO2e.
Inefficient stocks will be much harder hit
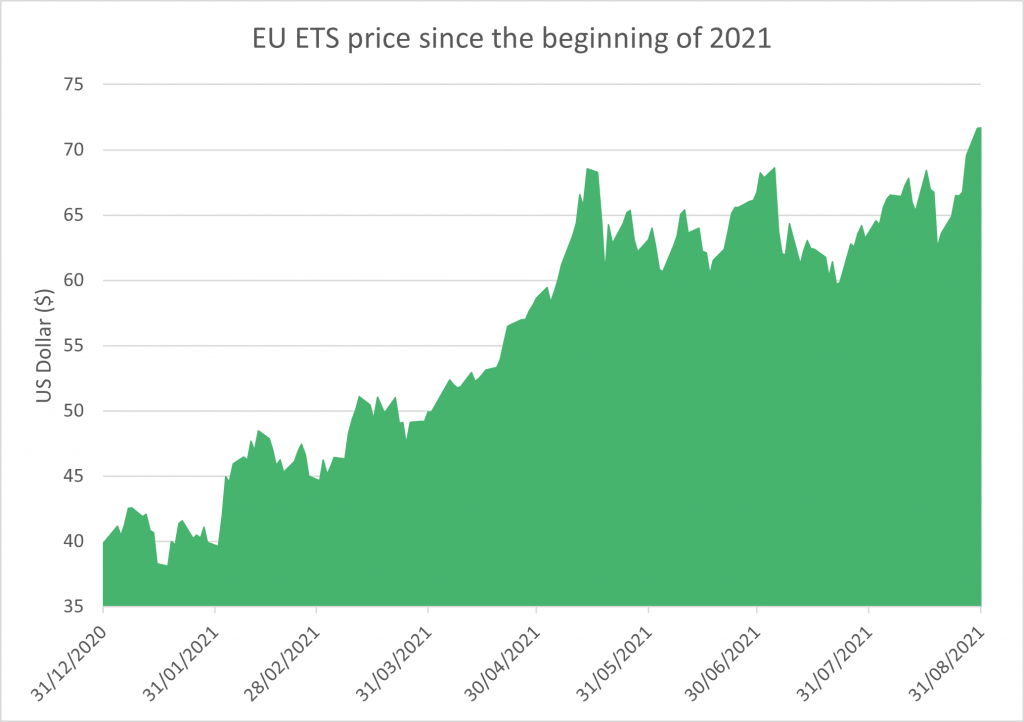
In August this year, the EU ETS price set a new record at $70 having risen from $40 at the end of 2020. If all emissions of the Efficient portfolio were covered by a carbon price at the current level of $70, the underlying companies would face an aggregate bill of $44 billion. Given the companies in the Efficient portfolio have a market size of about $14.1 trillion, for the investment community, the bill equates to $3.1 million per billion dollars invested. The companies in the Efficient portfolio generate income net of total expenses of about $392 billion. If all their emissions were covered by a price of $70, a figure that lies within the scientifically recommended range and more accurately reflects the harmful externalities created through their operations, the firms’ aggregate net profit would be 11% lower – a sizeable impact.
Remember that we have retained exposure to all sectors, the Inefficient portfolio would be hit much harder. The portfolio of highly polluting companies already generates much lower aggregate net income ($269 billion)[2], albeit part of this could be a reflection of their smaller size. Nonetheless, the substantially higher environmental footprint of these companies would translate into much larger aggregate cost of carbon of $116 billion, approximately 43% of net profit, a cost that would have devastating impact on the economic viability of these companies. Relative to the market capitalization of the Inefficient companies, the carbon cost would amount to $15.2 million per billion dollars invested.
Some sectors will struggle more than others
Looking at sector level effects, the best-in-class Efficient portfolio as well as the worst-in-class Inefficient portfolio would, as of today, see the aggregate net profit of the oil and gas industry wiped out. The worst-in-class Inefficient portfolio would struggle even more as it would see the cement heavy construction industry and the energy-intensive industrial metals production generate an aggregate net loss as well. The same holds for utilities in the Inefficient portfolio whose energy mix relies more heavily on fossil fuels than the mix for companies in the Efficient portfolio that already tilt towards low-carbon energies.
Impact on worst-in-class companies more dramatic
Note that the above describes the aggregate loss across whole industries and sectors. There will, of course, be companies that on an individual basis are better placed than others, either because they are the least pollutive among their peers or they are spectacularly profitable. Nonetheless, their survival will be challenged in a world when the cost of environmental pollution to society is properly accounted for.

Even the least carbon intensive companies can struggle if their profitability levels are not high enough. This is reflected in the proportion of unprofitable companies by industry. Nearly 80% of the worst-in-class companies in the oil and gas industry would be unprofitable, and still 55% of best-in-class companies would face the same prospect if a global carbon price at $70 were introduced today. In other industries, such as the utilities and basic materials, the best-in-class companies are already today doing much better than their worst-in-class peers.
Companies can, of course, change over time. But the need for action becomes more urgent, and the required change more extreme, the worse the starting position is. The average best-in-class company has a bit more breathing room to implement the necessary change and is better placed to turn its business around; see for example the transformation of Danish Oil and Natural Gas into the renewable energy giant Ørsted.
However, the impact on the worst-in-class companies can be much more dramatic. As reported by Bloomberg New Energy Finance, the average carbon price per barrel has almost tripled for refiners in Europe in 2021 increasing pressure on margins in an already highly competitive refining market which will lead to a phase out of the most inefficient firms in the long term. The effects of environmental policy are not only felt in Europe. The worst polluters in intensive industries in China, such as aluminium or cement production, were recently ordered to shut down their operations for the government to meet energy intensity reduction goals, while the most efficient producers can continue to operate.
Conclusion
Resource efficient companies within their sector will be able to compete in a low carbon world. Not only are they better placed to manage the uncertainties of future environmental regulations, but they are already more resilient to the implications of higher carbon pricing. Resource Efficiency also identifies companies within the dirty sectors that stand a chance of achieving the drastic transformations required and that are often enabling the transition of other industries by doing the least possible environmental damage.
Resource efficient companies in each sector present the strongest business case for consideration by sustainable investors as they are the most likely candidates to achieve a successful transition to a green economy.
IMPORTANT INFORMATION:
This document was prepared and issued by Osmosis Investment Research Solutions Limited (“OIRS”). OIRS is an affiliate of Osmosis Investment Management US LLC (regulated in the US by the SEC) and Osmosis Investment Management UK Limited (regulated in the UK by the FCA). OIRS and these affiliated companies are wholly owned by Osmosis (Holdings) Limited (“Osmosis”), a UK based financial services group. Osmosis has been operating its Model of Resource Efficiency since 2011.
The examples of specific investments described herein should not be considered a recommendation to buy or sell any specific securities. There can be no assurance that such investments will be purchased in a client’s portfolio. It should not be assumed that any of the investments identified in these case studies will be profitable in the future. Whilst the information contained herein is believed to be accurate, no representation or warranty, express or implied, is or will be made, and no responsibility or liability is or will be accepted by Osmosis, or by any of its officers, employees or agents, in relation to the accuracy or completeness of this document or of any information contained within it.
[1] Emissions reporting is generally split into 3 ‘scopes’:
Scope 1 – Direct emissions from fuel combusted in company-owned or controlled facilities and vehicles
Scope 2 – Indirect emissions from the generation of purchased electricity, steam, or heating and cooling that is consumed by the reporting company
Scope 3 – All other upstream and downstream emissions in the value chain and within the assessment scope
[2] We acknowledge that the analysis is an approximation and that the financial impact could be overestimated given that a portion of the emissions of both the Efficient and the Inefficient portfolios have already been subjected to a carbon tax. However, most industries in the MSCI World are not covered by a carbon pricing mechanism such that our simplified example gives a better idea of the true extent of a strict carbon tax.


